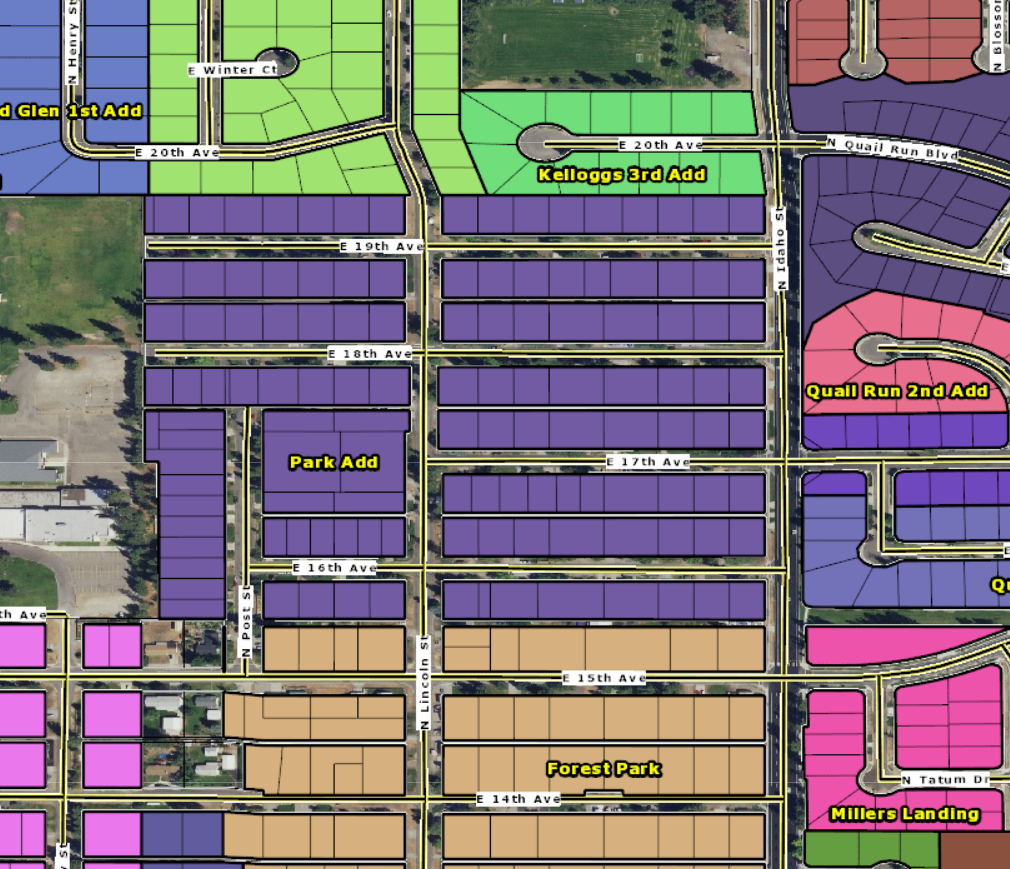
 Map of Park Addition
Request Your Free Market Analysis Here!
No Park Addition home sales during the 4th quarter of 2023.
No Park Addition home sales in the 3rd quarter of 2023.
No Park Addition home sales in Post Falls, Idaho during the 2nd quarter of 2023.
2 Homes were sold at the Park Addition in Post Falls, Idaho in the 1st quarter of 2023.
These home sales were ranchers that sold for an average of $237 per sq.ft. and were on the market for an average of 49 days. The average lot size was 0.23 acres.
These homes sold for an average of 97% of the original listed price and have an average of 3 bedrooms and 2 bathrooms. The high seller of the group sold for an average of $302 per sq.ft. The low seller of the group sold for an average of $171 per sq.ft.
No home sales at the Park Addition subdivision in Post Falls, Idaho in the 4th quarter of 2022.
No home sales at the Park Addition subdivision in Post Falls, Idaho in the 3rd quarter of 2022.
No home sales at the Park Addition subdivision in Post Falls, Idaho in the 2nd quarter of 2022.
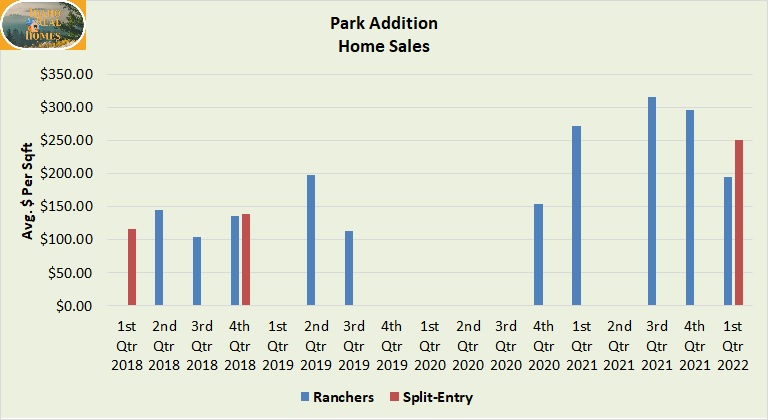 1st Quarter of 2022
3 Homes were sold at the Park Addition community during the 1st quarter of 2022.
1 Split-entry home sold for an average of $250 per SqFt. and the average time on the market was 52 days. The average size of the lot was 0.21 acres. This home sold for an average of 100% of the listed price and has an average of 4 bedrooms and 2 bathrooms.
2 Ranchers sold for an average of $194 per SqFt. and the average time on the market was 15 days. The average lot size was 0.21 acres.
These homes sold for an average of 100% of the listed price and have an average of 4 bedrooms and 2 bathrooms. The high seller of the group sold for an average of $249 per SqFt. The low seller of the group sold for an average of $139 per SqFt.
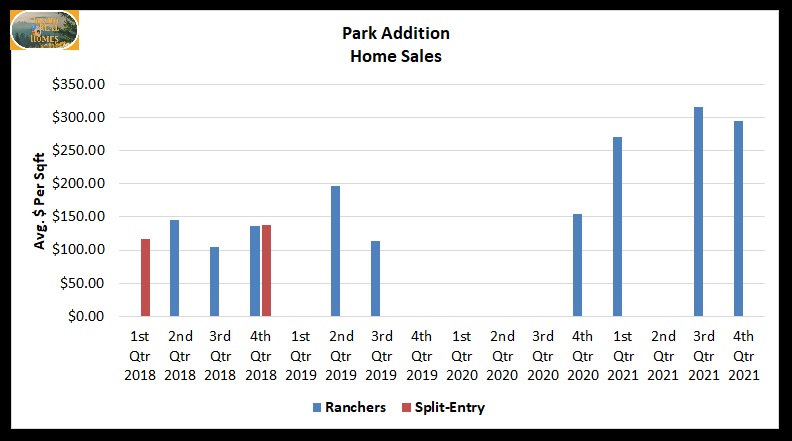
1 Home sold in the Park Addition subdivision during the 4th quarter of 2021.
This home sale was a rancher that sold for an average of $295 per sqft. and the average time on the market was 75 days. The average size of the lot was 0.14 acres. This home sold for an average of 96% of the listed price and has an average of 3 bedrooms and 2 bathrooms.
1 Home sold in the Park Addition community during the 3rd quarter of 2021.
This home sale was a rancher that sold for an average of $316 per sqft. The average time on the market was 47 days. The average size of the lot was 0.23 acres. This home sold for an average of 101% of the listed price and has an average of 3 bedrooms and 2 bathrooms.
No home sales during this quarter.
1 Home sold in the Park Addition subdivision during the 1st quarter of 2021.
This home sale was an existing rancher that sold for an average of $271 per sqft. The average time on the market was 1 day. This home sold for an average of 100% of the listed price and has an average of 3 bedrooms and 1 bathroom.

1 Home sold in the Park Addition subdivision during the 4th quarter of 2020.
This home sale was an existing rancher that sold for an average of $154 per sqft. The average time on the market was 52 days. The average size of the lot was 0.2 acres. This home sold for an average of 114% of the original listed price.
No home sales during this quarter.
No home sales for this quarter.
No home sales for this quarter.
No home sales for this quarter.
1 Home sold in the Park Addition subdivision in Post Falls Idaho during the 3rd quarter of 2019.
This was an existing rancher home sale that sold for an average of $113 per sqft. and spent an average of 56 days on the market. The average size of the lot was 0.2 acres. This home sold for an average of 92% of the listed price and has an average of 5 bedrooms and 2 bathrooms.
2 Homes sold in the Park Addition community during the 2nd quarter of 2019.
These two homes were both existing Ranchers that sold for an average of $197 per sqft. and spent an average of 46 days on the market. The average lot size was 0.21 acres. These homes sold for an average of 101% of the listed price and have an average of 3 bedrooms and 1.5 bathrooms.
No home sales this quarter in the Park Addition community.
2 Homes sold at the Park Addition subdivision during the 4th quarter of 2018.
1 Rancher sold for an average of $136 per sqft. and the average time on the market was 32 days. The average size of the lot was 0.21 acres. This home sold for an average of 100% of the listed price and has an average of 4 bedrooms and 2.5 bathrooms.
1 Split-entry home sold for an average of $138 per sqft. and the average time on the market is 104 days. The average size of the lot was 0.21 acres. This home sold for an average of 100% of the listed price and has an average of 4 bedrooms and 2 bathrooms.
2 Homes were sold at the Park Addition subdivision during the 3rd quarter of 2018.
These home sales were ranchers that sold for an average of $104 per sqft. The average time on the market was 98 days. The average lot size was 0.21 acres.
These homes sold for an average of 95% of the listed price and have an average of 4 bedrooms and 2 bathrooms. The high seller of the group sold for an average of $107 per sqft. The low seller of the group sold for an average of $101 per sqft.
3 Homes sold in the Park Addition subdivision during the 2nd quarter of 2018.
These home sales were ranchers that sold for an average of $145 per sqft. The average time on the market was 38 days. The average lot size was 0.24 acres.
These homes sold for an average of 101% of the listed price and have an average of 3 bedrooms and 2 bathrooms. The high seller of the group sold for an average of $168 per sqft. The low seller of the group sold for an average of $103 per sqft.
1 Home sold in the Park Addition subdivision during the 1st quarter of 2018.
This home sale was a split-entry home that sold for an average of $116 per sqft. The average time on the market was 114 days. The average size of the lot was 0.21 acres. This home sold for an average of 98% of the listed price and has an average of 4 bedrooms and 2 bathrooms.