
350 E Kathleen Ave
ste, 400
Coeur d' Alene, Id
83815
1-208-719-9010
Call or text
Mon - Fri: 9:00 - 5pm
Weekends by appointment Book your apt Here

ste, 400
Coeur d' Alene, Id
83815
Call or text
Weekends by appointment Book your apt Here

ste, 400 Coeur d' Alene, Id 83815
Call or text
Weekends by appointment
Book your apt Here
Last updated on February 24th, 2023 at 12:32 pm
101 Homes were sold in Coeur d’Alene, Idaho in the month of July 2022. CDA homes on city lots sold for an overall average of $339 per sq.ft., were on the market for an average of 67 days, and sold for an average of 95% of the original listed price. The average sales price per square foot is up 17% over July 2021, sales volume is down 30%.
July 2022 had 144 home sales in Coeur d’Alene: homes on city lots sold for an overall average of $289 per sq.ft., were on the market for an average of 56 days, and sold for an average of 96% of the original listed price.
July 2020 had 183 home sales. July 2019 had 205 home sales, July 2018 had 157 home sales, and July 2017 had 139 home sales.
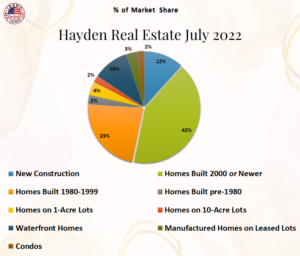
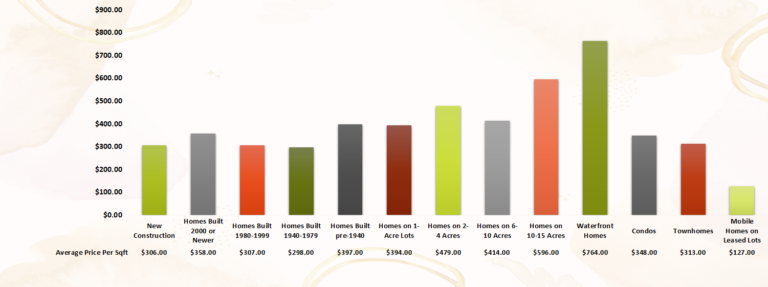
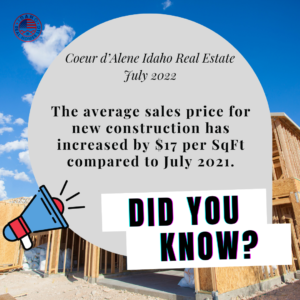
The volume of new construction home sales has remained the same and the average sales price has increased by $17 per SqFt compared to July 2021.
7 New construction homes sold in July 2022 for an average of $306 per SqFt. The average time on the market was 77 days. The average lot size was 0.2 acres.
These homes sold for an average of 99% of the original listed price. The high seller of the group sold for an average of $390 per SqFt and was from the Columbus Park subdivision. The low seller of the group sold for an average of $220 per SqFt and was from The Trails subdivision.
7 New construction homes sold in July 2021 for an average of $289 per sqft.
16 New construction homes sold during July 2020 for an average of $189 per sqft. 17 New Construction homes sold in July 2019 for an average of $207 per sqft. 20 New Construction homes sold in July 2018 for an average price of $185 per square foot. July 2017: 16 homes sold for an average of $145 per sqft.

The volume of home sales in this group has increased by 2 homes and the average sales price has increased by $60 per SqFt compared to July 2021.
40 Existing homes that were built after 2000 sold in July 2022 for an average of $358 per SqFt. The average time on the market was 76 days. The average lot size was 0.19 acres.
These homes sold for an average of 96% of the original listed price. The high seller of the group sold for an average of $693 per SqFt and was from the Club at Rock Creek subdivision. The low seller of the group sold for an average of $198 per SqFt and was from the CDA Place subdivision.
Home sales in this group include homes from CDA Place; The Landings at Waterford; Hawk’s Nest; Armstrong Park; The Trails; Lake Forest; Bentwood Park; Sunshine Meadows; Garden Grove; Best Lands; and Black Rock communities.
38 Homes were sold in July 2021 for an average of $298 per sqft. and the average time on the market was 58 days.
60 Existing homes were sold in July 2020 for an average of $209 per sqft. The average DOM was 92. July 2019 had 64 homes sell for an average of $178 per sqft. and the average DOM was 56. July 2018 had 36 homes sell for an average of $160 per sqft. and the average DOM was 72. July 2017 had 37 homes sell for an average of $135 per sqft. and the average DOM was 57.
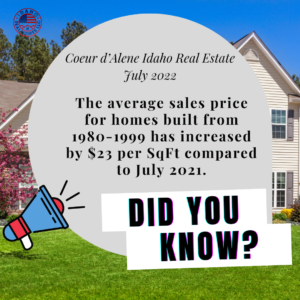
The volume of home sales in this group has decreased by 21 homes and the average sales price has increased by $23 per SqFt compared to July 2021.
11 Homes built from 1980-1999 sold in July 2022 for an average of $307 per SqFt. The average time on the market was 50 days. The average lot size was 0.27 acres.
These homes sold for an average of 94% of the original listed price. The high seller of the group sold for an average of $411 per SqFt and was from the Hill View Estates. The low seller of the group sold for an average of $198 per SqFt and was from the CDA Place subdivision.
Home sales in this group include homes from Best Lands; Whispering Pines; Woodland Meadows; and Hayden View Estates.
32 Homes that were built from 1980-1999 were sold in July 2021 for an average of $284 per sqft. and the average time on the market was 48 days.
21 Homes were sold in July 2020 for an average of $176 per sqft. The average DOM was 67. July 2019 had 27 homes sell for an average of $158 per sqft. and the average DOM was 65. 37 Homes sold in July 2018 for an average price per sqft of $170 with an average of 65 days on the market. 16 Homes sold in July 2017 for an average of $127 per SqFt and the average DOM was 57.
The volume of home sales in this group has decreased by 7 homes and the average sales price has increased by $45 per SqFt compared to July 2021.
15 Homes built from 1940-1979 sold in July 2022 for an average of $298 per SqFt. The average time on the market was 56 days. The average lot size was 0.23 acres.
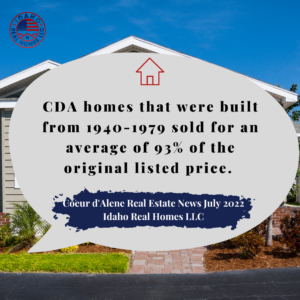
These homes sold for an average of 93% of the original listed price. The high seller of the group sold for an average of $520 per SqFt and was from the Parsons subdivision. The low seller of the group sold for an average of $158 per SqFt.
22 Homes were sold in July 2021 for an average of $253 per sqft. and the average time on the market was 49 days.
26 Homes sold in July 2020 for an average of $201 per sqft. The average DOM was 75. July 2019 had 28 homes sell for an average of $145 per sqft. and the average DOM was 62. July 2018 had 22 homes sell for an average price per sqft of $156 with an average of 50 DOM. 16 Homes sold in July 2017 for an average of $110 per SqFt and the average DOM was 61.
The volume of home sales in this group has decreased by 7 homes and the average sales price has increased by $45 per SqFt compared to July 2021.
15 Homes built from 1940-1979 sold in July 2022 for an average of $298 per SqFt. The average time on the market was 56 days. The average lot size was 0.23 acres.
These homes sold for an average of 93% of the original listed price. The high seller of the group sold for an average of $520 per SqFt and was from the Parsons subdivision. The low seller of the group sold for an average of $158 per SqFt.
22 Homes were sold in July 2021 for an average of $253 per sqft. and the average time on the market was 49 days.
26 Homes were sold in July 2020 for an average of $201 per sqft. The average DOM was 75. July 2019 had 28 homes sell for an average of $145 per sqft. and the average time on the market was 62 days. July 2018 had 22 homes sell for an average price per sqft of $156 with an average of 50 days on the market. 16 Homes sold in July 2017 for an average price per square foot of $110. They averaged 61 days on the market.
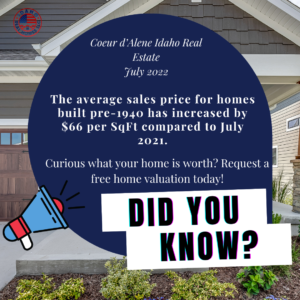
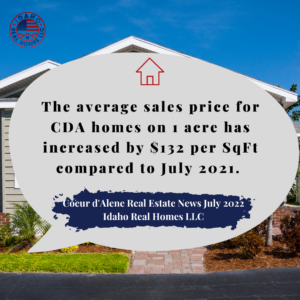
The volume of home sales in this group has decreased by 2 homes and the average sales price has increased by $132 per SqFt compared to July 2021.
3 Homes sold in the 1-acre group in July 2022 for an average of $394 per SqFt. The average time on the market was 24 days. The average lot size was 1.2 acres.
These homes sold for an average of 92% of the original listed price. The high seller of the group sold for an average of $671 per SqFt and was from the Syringa Heights subdivision. The low seller of the group sold for an average of $212 per SqFt and was from the Rude subdivision.
5 Homes sold in the 1-acre group in July 2021 for an average of $262 per sqft. and the average time on the market was 84 days.
10 Homes sold in July 2020 for an average of $208 per sqft. The average DOM was 84. 8 Homes were sold during July 2019 for an average of $170 per sqft. The average DOM was 69. July 2018 had 4 homes sell for an average of $262 per sqft. July 2017 had 2 homes sell for an average of $144 per sqft.
The volume of home sales in this group has decreased by 3 homes and the average sales price has decreased by $16 per SqFt compared to July 2021.
1 Home sold in the 2-4 acre group in July 2022 for an average of $479 per SqFt. The average time on the market was 44 days. The average lot size was 2.9 acres. This home sold for an average of 92% of the original listed price.
4 Homes sold in the 2-4 acre in July 2021 for an average of $495 per sqft. and the average time on the market was 48 days.
4 Homes sold in the 2-4 acre group during July 2020 for an average of $162 per sqft. and the average time on the market was 134 days. July 2019 had 3 homes sell for an average of $229 per sqft. and the average time on the market was 93 days. July 2018 had 3 homes sell in the 2-4 acre group for an average of $178 per sqft. No July 2017 home sales.

The volume of home sales in this group has decreased by 3 homes and the average sales price has increased by $22 per SqFt compared to July 2021.
2 Homes sold in the 6-10 acre group in July 2022 for an average of $414 per SqFt. The average time on the market was 35 days. The average lot size was 8.5 acres. These homes sold for an average of 100% of the listed price. The high seller of the group sold for an average of $472 per SqFt. The low seller of the group sold for an average of $357 per SqFt.
5 Homes sold in the 6-10 acre group in July 2021. The average sales price was $392 per sqft. and the average time on the market was 45 days.
6 Homes sold in the 6-10 acre group in July 2020 for an average of $276 per sqft. The average time on the market was 91 days. July 2019 had 5 homes sell for an average of $206 per sqft. and the average time on the market was 82 days. No July 2018 Sales in this category. July 2017 had 3 homes sell for an average of $165 per square foot.
The volume of home sales in this group has increased by one home and the average sales price has increased by $310 per SqFt compared to July 2021.
2 Homes sold in the 10-15 acre group in July 2022 for an average of $596 per SqFt. The average time on the market was 61 days. The average lot size was 14 acres. These homes sold for an average of 87% of the original listed price. The high seller of the group sold for an average of $932 per SqFt. The low seller of the group sold for an average of $260 per SqFt.
1 Home sold in the 10-15 acre group in July 2021 for an average of $286 per sqft. and the average time on the market was 36 days.
2 Homes sold in the 10-15 acre group in July 2020 for an average of $291 per sqft. The average time on the market was 266 days. 2 Homes with 10-15 acre lots were sold in July 2019 for an average price of $180 per sqft. These homes spent an average of 51 days on the market. No 2018 sales in this category.
No July 2022 Coeur d’Alene home sales in this group.
1 Home with over 15 acres sold in July 2021 for an average of $457 per sqft. and the average time on the market was 103 days.
2 Homes sold in July 2020 for an average of $310 per sqft. The average time on the market was 390 days. No 2019 or 2018 home sales in July. July 2017 had 2 homes sell for an average of $234 per sqft.
3 Waterfront homes sold in Coeur d’Alene in July 2022 for an average of $764 per SqFt. The average time on the market was 65 days. The average lot size was 0.4 acres.
These homes sold for an average of 92% of the listed price. The high seller of the group sold for an average of $931 per SqFt and was from the Edgewater at Mill River subdivision. The low seller of the group sold for an average of $623 per SqFt and was from the Rockford Bay subdivision.
1 Waterfront condo sold in July 2022 for an average of $1,027 per SqFt. The average time on the market was 76 days. The average size of the lot was 0.02 acres. This condo sold for an average of 98% of the listed price and was from the Riverfront House Condos.
2 Waterfront homes sold in July 2021 for an average of $571 per sqft. & the average time on the market was 44 days.
7 Waterfront homes sold during July 2020 for an average of $463 per sqft. The average time on the market was 72 days. 7 Waterfront homes were sold in July 2019 for an average of $367 per sqft. They spent an average of 96 days on the market. July 2018 had 3 waterfront homes sell for an average of $439 per sqft. 8 Waterfront homes sold in July 2017 for an average of $377 per sqft.
The volume of condo sales has decreased by 5 homes and the average sales price has increased by $7 per sqft compared to July 2021.
5 Condos sold in July 2022 for an average of $348 per SqFt. The average time on the market was 46 days. The average lot size was 0.03 acres.
These homes sold for an average of 96% of the listed price. The high seller of the group sold for an average of $537 per SqFt and was from Sanders Park. The low seller of the group sold for an average of $274 per SqFt.
10 Condos sold in Coeur d’Alene, Idaho during July 2021. The average sales price was $341 per sqft. and the average time on the market was 37 days.
10 Condos sold in July 2020 for an average of $272 per sqft. The average time on the market was 64 days. 11 Condos were sold in July 2019 for an average price of $202 per sqft. These homes spent an average of 70 days on the market. 2018 July had 11 condos sell this month for an average of $211 per sqft. 2017 Condo sales in July had 8 condos sell that averaged $174 per square foot.
1 Townhome sold for an average of $313 per SqFt. The average time on the market was 30 days. This home sold for an average of 98% of the listed price and was from the Village Condos.
2 Townhomes sold for an average of $295 per sqft. and the average time on the market was 23 days.
1 Townhome sold during July 2020 for an average of $166 per sqft. The average time on the market was 66 days.
4 Manufactured homes on leased lots sold in July 2022 for an average of $127 per SqFt. The average time on the market was 77 days.
These homes sold for an average of 84% of the original listed price. The high seller of the group sold for an average of $148 per SqFt and was from the Oakcrest Park. The low seller of the group sold for an average of $99 per SqFt and was also from Oakcrest.
1 Manufactured home on a leased lot sold in July 2021 for an average of $165 per sqft. and the average time on the market was 62 days.
4 Manufactured homes on rented lots sold during July 2020 for an average of $73 per sqft. The average time on the market was 37 days.10 Manufactured homes sold in Coeur d’Alene during the month of July 2019. They sold for an average of $59 per sqft. These homes spent an average of 34 days on the market. July 2018 had 5 homes on leased lots sell for an average of $56 per square foot. They spent an average of 29 days on the market. July 2017 had 10 homes sell for an average price per square foot of $44. 36 days on the market on average.
Request your Homes Market Valuation Here! If you are considering selling your home you are in the right spot! Let someone help you that understands the market! For more information about Coeur d’Alene, Idaho visit our Coeur d’Alene Real Estate page here.