ste, 400
Coeur d' Alene, Id
83815
Call or text
Weekends by appointment Book your apt Here
ste, 400 Coeur d' Alene, Id 83815
Call or text
Weekends by appointment
Book your apt Here
Last updated on December 20th, 2022 at 11:23 am
Hayden housing market overview from October 2022.
39 homes were sold in Hayden, Idaho in the month of October 2022. The average sales price for all Hayden homes was $350 per SqFt and they spent an average of 97 days on the market. The Hayden housing market is shifting quite a bit. The volume of home sales has decreased significantly, 33 fewer homes were sold this October compared to October 2021’s 72 home sales. Volume is down 54% over October 2021.
Single-family homes on less than an acre overall sold for an average of $320 per SqFt & were on the market an average of 91 days. The average price per square foot of single-family homes on less than an acre has increased by 7% and on average it takes 5% longer to sell a Hayden home compared to October 2021.
October 2020 had 77 home sales, October 2019 had 57 home sales, October 2018 had 61 home sales, and October 2017 had 60 home sales.
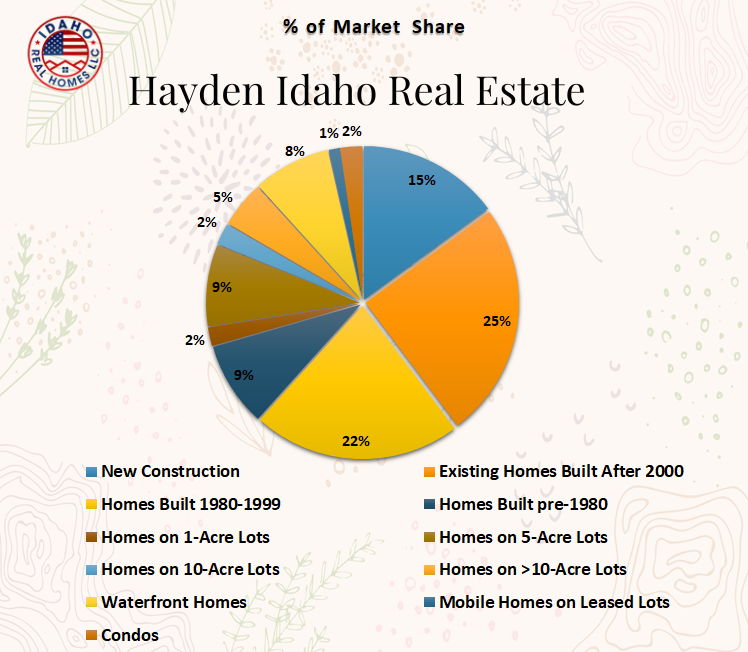
In our monthly real estate market report, we have the average price per square foot of new construction homes, homes on city lots, homes on acreage, waterfront, and much more. We also have the average days on the market for each group of homes and how much of the original listed price they sold for.
Are you curious about past market reports or want more information about Hayden? Visit our community page and contact us today!
The Hayden housing market volume for new construction home sales has decreased by 2 homes and the average sales price per SqFt has decreased by 11% compared to October 2021.
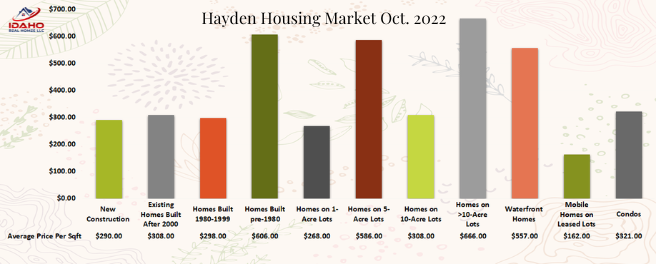
7 New construction homes were sold in Hayden in October 2022 for an average of $290 per SqFt. The average lot size was 0.2 acres.
These homes sold for an average of 98% of the original listed price. The high seller of the group sold for an average of $363 per SqFt and was from the Brantley Estates subdivision. The low seller of the group sold for an average of $223 per SqFt and was from the Carrington Meadows subdivision.
9 New construction homes sold in October 2021 for an average of $328 per sqft. The average lot size was 0.28 acres.
13 New construction homes sold in October 2020 for an average of $220 per sqft. October 2019 had 5 new construction homes sell for an average of $190 per sqft. 13 New construction homes sold in October 2018 for an average of $193 per sqft. 6 New Construction homes were sold in October 2017 for an average price per sqft. of $139.
The volume of home sales, for homes built after 2000, has decreased by 35% and the average sales price has increased by $3 per SqFt compared to October 2021.
11 Existing homes that were built after 2000 were sold in October 2022 for an average of $308 per SqFt. The average time on the market was 69 days. The average lot size was 0.27 acres.
These homes sold for an average of 92% of the original listed price. The high seller of the group sold for an average of $464 per SqFt and was from the Hayden Lake Country Club Estates subdivision. The low seller of the group sold for an average of $255 per SqFt and was from the Strawberry Fields subdivision.
17 Homes sold in October 2021 for an average of $305 per sqft. The average time on the market was 74 days. The average lot size was 0.3 acres.
23 Homes sold in October 2020 for an average of $238 per sqft. The average time on the market was 47 days. 11 Homes sold in October of 2019 for an average of $186 per sqft. and the average time on the market was 109 days. 17 Homes sold in October 2018 for an average of $181 per sqft. and spent an average of 89 days on the market. 38 Existing homes sold in October 2017 for an average price per sqft. of $139 and were on the market for an average of 69 days.
The Hayden housing market volume, for homes built from 1980-1999, has decreased by 33% and the average sales price per SqFt has increased by 12% compared to October 2021.
10 Homes that were built from 1980-1999 were sold in October 2022 for an average of $298 per SqFt. The average time on the market was 95 days. The average lot size was 0.26 acres.
These homes sold for an average of 89% of the original listed price. The high seller of the group sold for an average of $364 per SqFt and was from the Millers Corner subdivision. The low seller of the group sold for an average of $217 per SqFt.
Home sales in this group include homes from the Woodland Meadows and Loch Haven Hills communities.
15 Homes that were built 1980-1999 sold in October 2021 for an average of $267 per sqft. The average time on the market was 65 days. The average lot size was 0.24 acres.
16 Homes sold in October 2020 for an average of $240 per sqft. The average time on the market was 35 days. 12 Homes sold in October 2019 for an average of $153 per sqft. and spent an average of 52 days on the market. 10 Homes sold in October 2018 for an average of $156 per sqft. and spent an average of 74 days on the market.

The volume of home sales, for homes built pre-1980, has decreased by 60% and the average sales price has increased by $291 per SqFt compared to October 2021.
2 Homes that were built prior to 1980 were sold in October 2022 for an average of $606 per SqFt. The average time on the market was 108 days. The average lot size was 0.5 acres.
These homes sold for an average of 86% of the original listed price. The high seller of the group sold for an average of $944 per SqFt and was from the Wrights Park subdivision. The low seller of the group sold for an average of $268 per SqFt.
5 Homes that were built pre-1980 sold in October 2021 for an average of $315 per sqft. The average time on the market was 93 days.
9 Homes sold in October 2020 for an average of $198 per sqft. The average time on the market was 60 days. 8 Homes sold in October 2019 for an average of $135 per sqft. and spent an average of 88 days on the market. 8 Homes sold in October of 2018 for an average price per sqft of $125 with an average of 74 days on market.
The volume of home sales on 1-acre lots has decreased by 6 homes and the average sales price has decreased by $27 per SqFt compared to October 2021.
1 Home sold in the 1-acre category in October 2022 for an average of $268 per SqFt. The average time on the market was 113 days. The average size of the lot was 1 acre. This home sold for an average of 65% of the original listed price and was from the Avondale subdivision.
7 Homes sold in October 2021 for an average of $295 per sqft. The average time on the market was 69 days. The average lot size was 1.5 acres.
No home sales in this group during October 2020. 2 Homes sold in October 2019 for an average of $192 per sqft. and spent an average of 81 days on the market. 4 Homes sold in October 2018 for an average of $231 per sqft. and spent an average of 31 days on the market. 4 Homes sold in October 2017 for an average of $204 per sqft. and spent an average of 95 days on the market.
The volume of home sales on 5 acres has decreased by 60% and the average sales price per SqFt has increased by $283 per SqFt compared to October 2021.
2 Homes were sold in this acreage group in October 2022 for an average of $586 per SqFt. The average time on the market was 67 days. The average lot size was 4 acres. These homes sold for an average of 99% of the original listed price. The high seller of the group sold for an average of $627 per SqFt. The low seller of the group sold for an average of $545 per SqFt.
5 Homes sold in October 2021 for an average of $303 per sqft. The average time on the market was 72 days. The average lot size was 4.9 acres.
2 Homes sold in October 2020 for an average of $260 per sqft. and the average time on the market was 18 days. 3 Homes sold in October 2019 for an average of $162 per sqft. and spent an average of 100 days on the market. 1 Home sold in October 2018 for an average of $189 per sqft. and spent an average of 27 days on the market. 2 Homes sold in October 2017 for an average of $204 per sqft. and spent an average of 95 days on the market.
One less home sold in this group compared to October 2021 and the average sales price has decreased by $7 per SqFt.
1 Hayden home on 10 acres sold in October 2022 for an average of $308 per SqFt. The average time on the market was 207 days. The average size of the lot was 10 acres. This home sold for an average of 72% of the original listed price.
2 Homes sold in October 2021 for an average of $315 per sqft. The average time on the market was 113 days.
No October 2020 home sales in this group. No October 2019 home sales in this group. One home sold in October 2018 for an average of $124 per sqft. and spent an average of 97 days on the market. No October 2017 home sales to compare to.
1 Home with over 10 acres was sold in October 2022 for an average of $666 per SqFt. The average time on the market was 115 days. The average size of the lot was 121 acres! This home sold for an average of 88% of the original listed price.
No October 2021 home sales with over 10 acres to compare to.
No October 2020, 2019, 2018, or 2017 home sales to compare to.
The volume of waterfront home sales has decreased by 2 homes and the average sales price per SqFt has decreased by 16% compared to October 2021.
2 Waterfront homes were sold in Hayden, Idaho in October 2022 for an average of $557 per SqFt. The average time on the market was 108 days. The average lot size was 0.4 acres.
These homes sold for an average of 93% of the original listed price. The high seller of the group sold for an average of $619 per SqFt and was from the Honeysuckle Hills subdivision. The low seller of the group sold for an average of $495 per SqFt and was from the Emerald Estates subdivision.
4 Waterfront homes sold in October 2021 for an average of $646 per sqft. and the average time on the market was 140 days. The average lot size was 0.8 acres.
8 Waterfront homes sold in October 2020 for an average of $501 per sqft. The average time on the market was 72 days. 5 Waterfront homes sold in October 2019 for an average of $276 per sqft. and spent an average of 82 days on the market. 3 Waterfront homes sold in October 2018 for an average of $217 per sqft. and spent an average of 145 days on the market. 3 Waterfront homes sold in October 2017 for an average of $316 per sqft. and spent an average of 160 days on the market.

The volume of manufactured home sales has decreased by 4 homes and the average sales price has increased by $76 per SqFt compared to October 2021.
1 Manufactured home on a leased lot was sold in October 2022 for an average of $162 per SqFt. The average time on the market was 124 days. This home sold for an average of 90% of the original listed price and was from the Heatherstone 55+ Community.
5 Manufactured homes on leased lots sold in October 2021 for an average of $86 per sqft. The average time on the market was 45 days.
5 Manufactured homes sold in October 2020 for an average of $63 per sqft. The average time on the market was 49 days. 3 Manufactured homes on leased lots sold in October 2019 for an average of $86 per sqft. and the average time on the market was 71 days. No 2018 sales or 2017 sales to compare.
The volume of condo sales has decreased by 2 homes and the average sales price has decreased by $39 per SqFt compared to October 2021.
1 Condo was sold in October 2022 for an average of $321 per SqFt. The average time on the market was 166 days. The average size of the lot was 0.05 acres. This condo sold for an average of 84% of the original listed price and was from the Village at Hayden.
3 Condos sold in October 2021 for an average of $360 per sqft. The average time on the market was 34 days.
1 Condo sold in October 2020 for an average of $237 per sqft. and the average time on the market was 94 days. 3 Condos sold in October 2019 for an average of $225 per sqft. and spent an average of 56 days on the market. 2 Condos sold in October 2018 for an average price per sqft. of $178 and spent an average of 56 days on the market. 1 Condo sold in October 2017 for an average of $152 per sqft. and spent an average of 43 days on the market.