ste, 400
Coeur d' Alene, Id
83815
Call or text
Weekends by appointment Book your apt Here
ste, 400 Coeur d' Alene, Id 83815
Call or text
Weekends by appointment
Book your apt Here
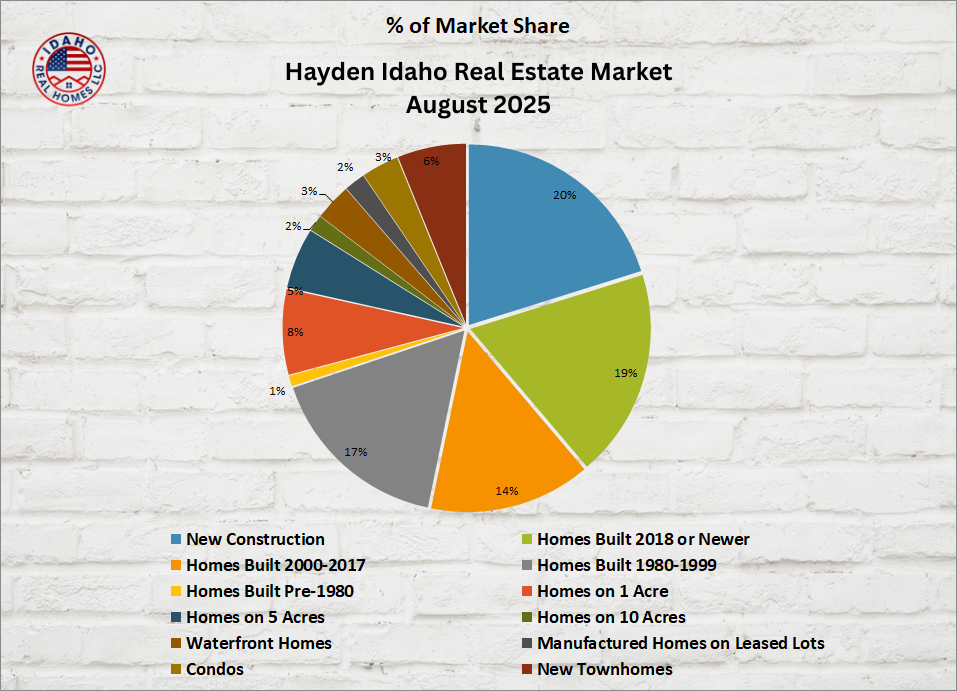
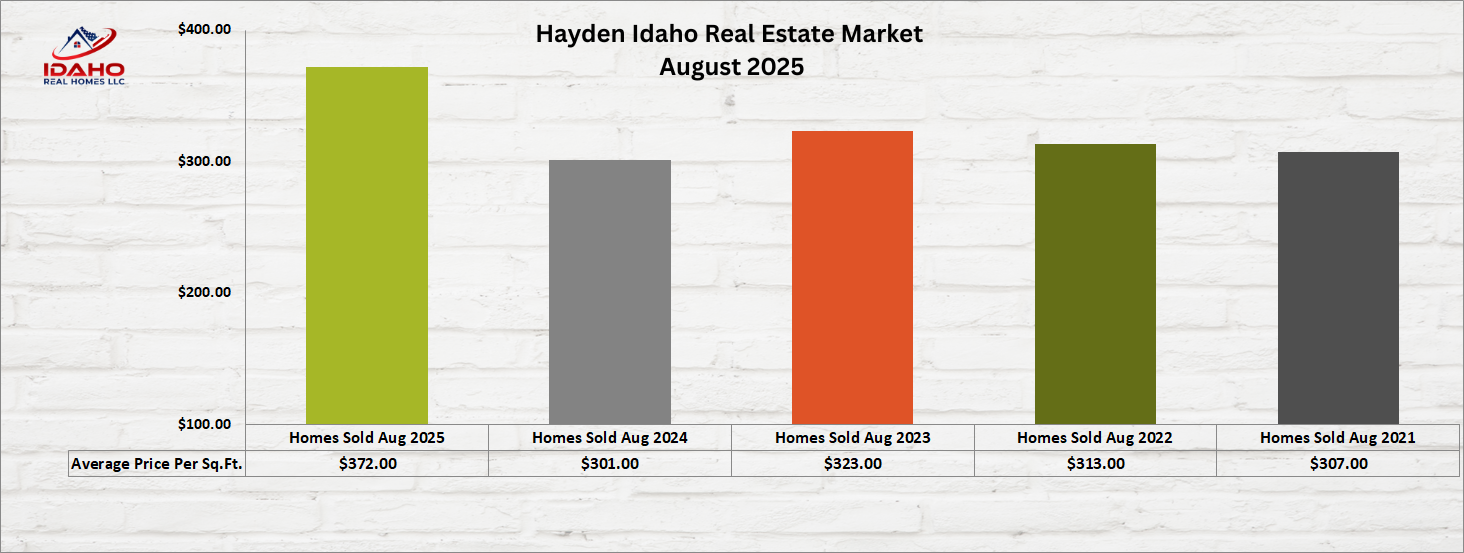
70 Homes were sold in Hayden, Idaho in August 2025 for an overall average of $372 per sq.ft. The average time on the market was 97 days and these homes sold for an average of 97% of the original listed price. The average sales price per sq.ft. is up 23% compared to August 2024. Volume is up 55%.
45 Homes were sold in Hayden, Idaho during August 2024 for an overall average of $301 per sq.ft. The average time on the market was 83 days and these homes sold for an average of 98% of the original listed price.
43 Homes were sold in August 2023, 46 Homes were sold in August 2022, August 2021 had 65 home sales, and August 2020 had 74 home sales.
Read more to learn about the average home values and more for new construction, existing homes, homes on acreage, waterfront, and more in Hayden, Idaho.
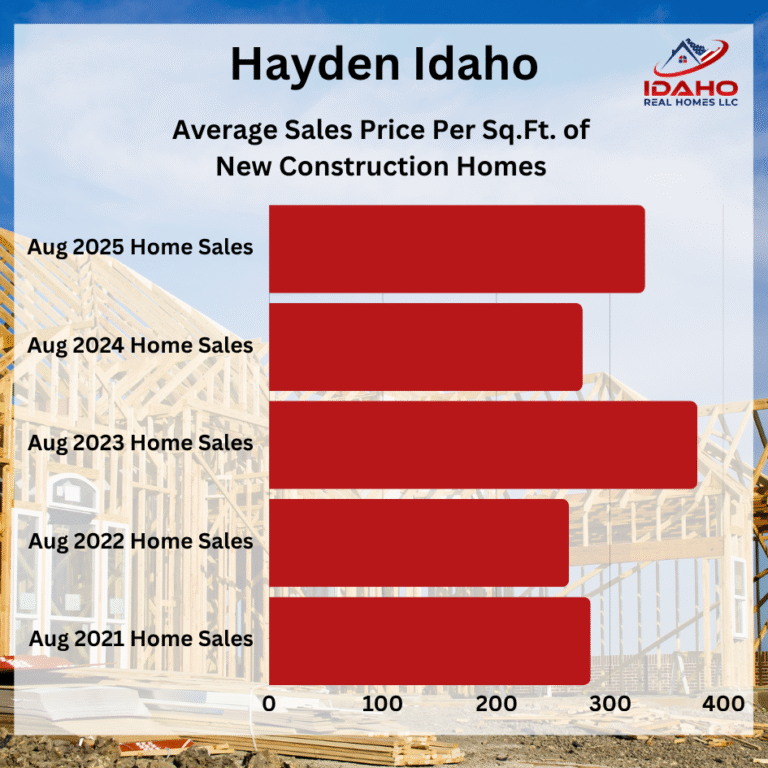
15 New construction homes were sold in Hayden, Idaho in August 2025 for an average of $331 per sq.ft. The average lot size was 0.2 acres.
These homes sold for an average of 99% of the original listed price. The high seller of the group sold for an average of $603 per sq.ft. The low seller of the group sold for an average of $222 per sq.ft.
13 New construction homes were sold in August 2024 for an average of $276 per sq.ft.
5 New homes sold in August 2023 for an average of $377 per sq.ft. 4 New construction homes were sold in August 2022 for an average of $264 per SqFt. 9 New homes sold in August 2021 for an average of $283 per sqft. 14 New homes sold in August 2020 for an average of $178 per sqft.
10 Homes built in 2018 or newer were sold in Hayden, Idaho in August 2025 for an average of $459 per sq.ft. The average time on the market was 70 days. The average lot size was 0.38 acres.
These homes sold for an average of 96% of the original listed price. The high seller of the group sold for an average of $694 per sq.ft. The low seller of the group sold for an average of $291 per sq.ft.
5 Homes built 2018 or newer were sold in August 2024 for an average of $339 per sq.ft. The average time on the market was 64 days.
6 Homes sold in August 2023 for an average of $336 per sq.ft. Average DOM was 58. August 2022 had 4 homes sell for an average of $410 per sq.ft. Average DOM was 64. August 2021 had 6 homes sell for an average of $377 per sq.ft. Average DOM was 32. 2 Homes sold in August 2020 for an average of $177 per sq.ft. Average DOM was 27.
11 Homes built from 2000-2017 were sold in Hayden, Idaho in August 2025 for an average of $323 per sq.ft. The average time on the market was 61 days. The average lot size was 0.22 acres.
These homes sold for an average of 95% of the original listed price. The high seller of the group sold for an average of $500 per sq.ft. The low seller of the group sold for an average of $205 per sq.ft.
9 Homes built from 2000-2017 were sold in August 2024 for an average of $311 per sq.ft. The average time on the market was 55 days.
10 Homes sold in August 2023 for an average of $305 per sq.ft. Average DOM was 63.13 Homes sold in August 2022 for an average of $299 per sq.ft. Average DOM was 59. 17 Homes sold in August 2021 for an average of $327 per sq.ft. Average DOM was 50. 19 Homes sold in August 2020 for an average of $190 per sq.ft. Average DOM was 53.

12 Homes built from 1980-1999 were sold in Hayden in August 2025 for an average of $341 per sq.ft. The average time on the market was 41 days. The average lot size was 0.3 acres.
These homes sold for an average of 98% of the original listed price. The high seller of the group sold for an average of $390 per sq.ft. The low seller of the group sold for an average of $243 per sq.ft.
6 Homes built from 1980-1999 were sold in August 2024 for an average of $310 per sq.ft. The average time on the market was 81 days.
8 Homes sold in August 2023 for an average of $301 per sq.ft. Average DOM was 78. 6 Homes sold in August 2022 for an average of $330 per SqFt. Average DOM was 43. 11 Homes sold in August 2021 for an average of $286 per sqft. Average DOM was 47. 9 Homes sold in August 2020 for an average of $188 per sqft. Average DOM was 63.

1 Home built before 1980 was sold in Hayden, Idaho in August 2025 for an average of $237 per sq.ft. The average time on the market was 140 days. The average size of the lot was 0.3 acres. This home sold for an average of 78% of the original listed price.
1 Home built before 1980 was sold in August 2024 for an average of $272 per sq.ft. The average time on the market was 56 days.
3 Homes sold in August 2023 for an average of $324 per sq.ft. Average DOM was 55. 5 Homes sold in August 2022 for an average of $290 per SqFt. Average DOM was 53. 9 Homes sold in August 2021 for an average of $263 per sqft. Average DOM was 68. 9 Homes sold in August 2020 for an average of $217 per sqft. Avewrage DOM was 53.
3 Homes on 1-acre lots were sold in Hayden, Idaho in August 2025 for an average of $628 per sq.ft. The average time on the market was 62 days. The average lot size was 1.18 acres.
These homes sold for an average of 89% of the original listed price. The high seller of the group sold for an average of $1,184 per sq.ft. The low seller of the group sold for an average of $277 per sq.ft.
3 Homes on 1 acre were sold in August 2024 for an average of $309 per sq.ft. The average time on the market was 76 days.
4 Homes sold in August 2023 for an average of $387 per sq.ft. Average DOM was 77. 2 Homes sold in August 2022 for an average of $346 per SqFt. Average DOM was 54. 2 Homes sold in August 2021 for an average of $286 per sqft. Average DOM was 25. 2 Homes sold in August 2020 for an average of $214 per sqft. Average DOM was 26.
3 Homes on 5-acre lots were sold in Hayden, Idaho in August 2025 for an average of $446 per sq.ft. The average time on the market was 87 days. The average lot size was 5.8 acres.
These homes sold for an average of 92% of the original listed price. The high seller of the group sold for an average of $566 per sq.ft. The low seller of the group sold for an average of $279 per sq.ft.
1 Home sold in August 2024 for an average of $565 per sq.ft. The average time on the market was 28 days.
No Hayden home sales on 5 acres in August 2023 or 2022. 3 Homes sold in August 2021 for an average of $264 per sqft. Average DOM was 56. 3 Homes sold in August 2020 for an average of $247 per sqft. Average DOM was 65.
1 Home on a 10-acre lot was sold in August 2025 for an average of $355 per sq.ft. The average time on the market was 76 days. This home sold for an average of 94% of the original listed price.
No Hayden home sales on 10 acres in August 2024 or 2023.
3 Homes sold in August 2022 for an average of $440 per SqFt. Average DOM was 100. 1 Home sold in August 2021 for an average of $379 per sqft. Average DOM was 78. 2 Homes sold in August 2020 for an average of $330 per sqft. Average DOM was 130.
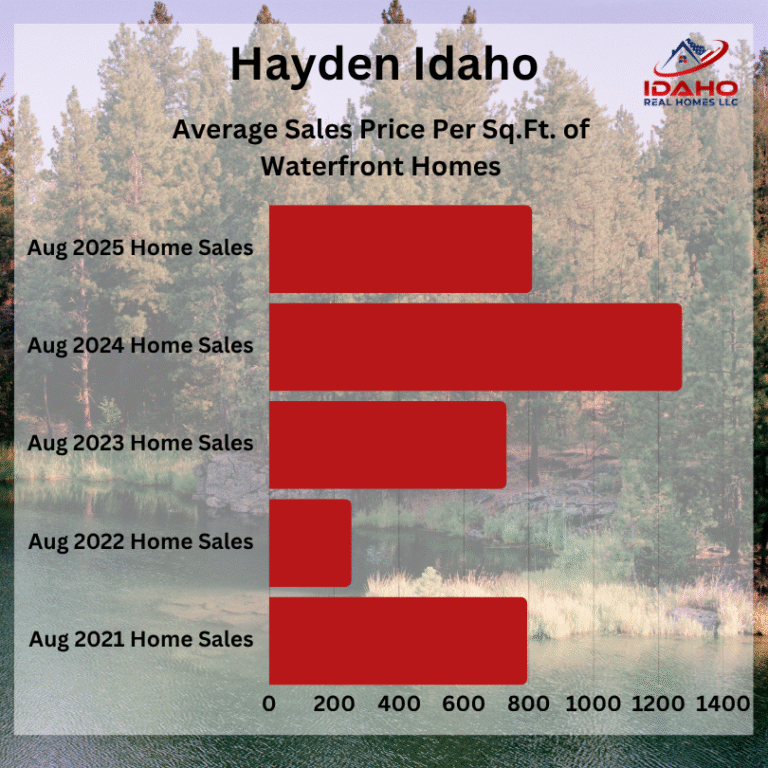
1 Waterfront home was sold in Hayden, Idaho in August 2025 for an average of $811 per sq.ft. The average time on the market was 192 days. The average lot size was 4.3 acres. This home sold for an average of 90% of the original listed price.
1 Waterfront home was sold in August 2024 for an average of $1,273 per sq.ft. The average time on the market was 22 days.
3 Waterfront homes were sold in August 2023 for an average of $732 per sq.ft. Average DOM was 59 . 1 Waterfront condo sold in August 2023 for an average of $254 per sq.ft. Average DOM was 57. 4 Waterfront homes sold in August 2022 for an average of $796 per SqFt. Average DOM was 53. 2 Waterfront homes sold in August 2021 for an average of $945 per sqft. Average DOM was 74. 6 Waterfront homes sold in August 2020 for an average of $414 per sqft. Average DOM was 98.
4 Manufactured homes on leased lots were sold in Hayden, Idaho in August 2025 for an average of $115 per sq.ft. The average time on the market was 165 days.
These homes sold for an average of 85% of the original listed price. The high seller of the group sold for an average of $141 per sq.ft. The low seller of the group sold for an average of $86 per sq.ft.
2 Manufactured homes on leased lots were sold in August 2024 for an average of $135 per sq.ft. The average time on the market was 35 days.
1 Manufactured home sold in August 2023 for an average of $115 per sq.ft. Average DOM was 62. 4 Manufactured homes sold in August 2022 for an average of $145 per SqFt. Average DOM was 32. 1 Manufactured home sold in August 2021 for an average of $130 per sqft. Average DOM was 56. 3 Manufactured homes sold in August 2020 for an average of $73 per sqft. Average DOM was 30.
3 Condos were sold in Hayden, Idaho in August 2025 for an average of $274 per sq.ft. The average time on the market was 33 days. The average lot size was 0.08 acres. These homes sold for an average of 95% of the original listed price.
2 Condos were sold in August 2024 for an average of $295 per sq.ft. The average time on the market was 175 days.
2 Condos were sold in August 2023 for an average of $308 per sq.ft. Average DOM was 60. 1 Condo sold in August 2022 for an average of $322 per SqFt. Average DOM was 41. No Condo sales in August 2021. 1 Townhome sold in August 2020 for an average of $277 per sqft. Average DOM was 13.

6 New construction townhomes were sold in Hayden, Idaho in August 2025 for an average of $252 per sq.ft. The average lot size was 0.06 acres. These homes sold for an average of 98% of the original listed price.
2 Townhomes were sold in Hayden, Idaho during August 2024 for an average of $225 per sq.ft. The average time on the market was 106 days.