ste, 400
Coeur d' Alene, Id
83815
Call or text
Weekends by appointment Book your apt Here
ste, 400 Coeur d' Alene, Id 83815
Call or text
Weekends by appointment
Book your apt Here
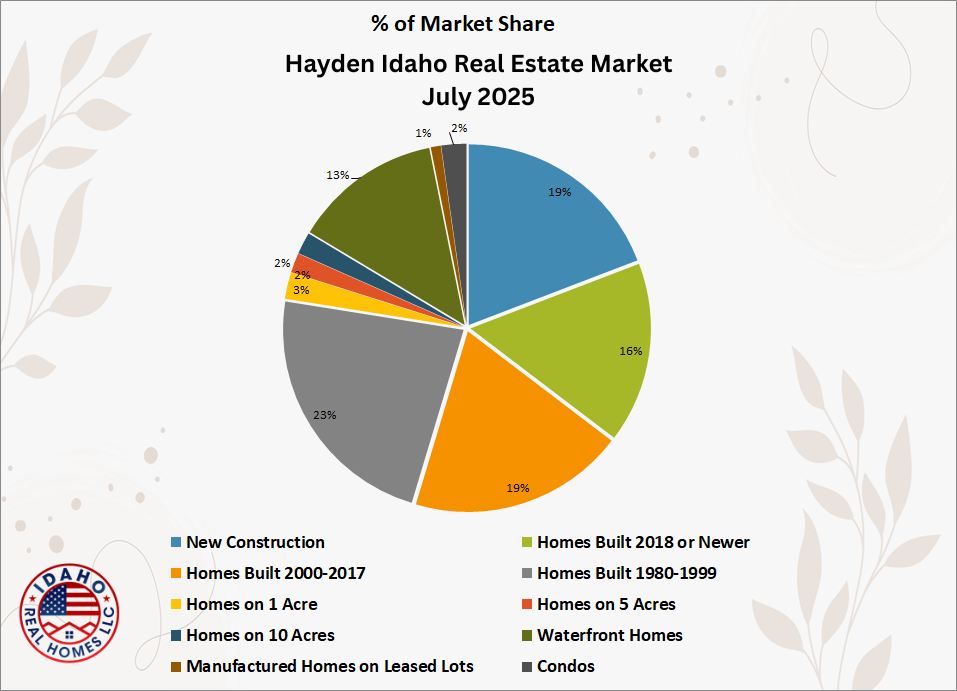
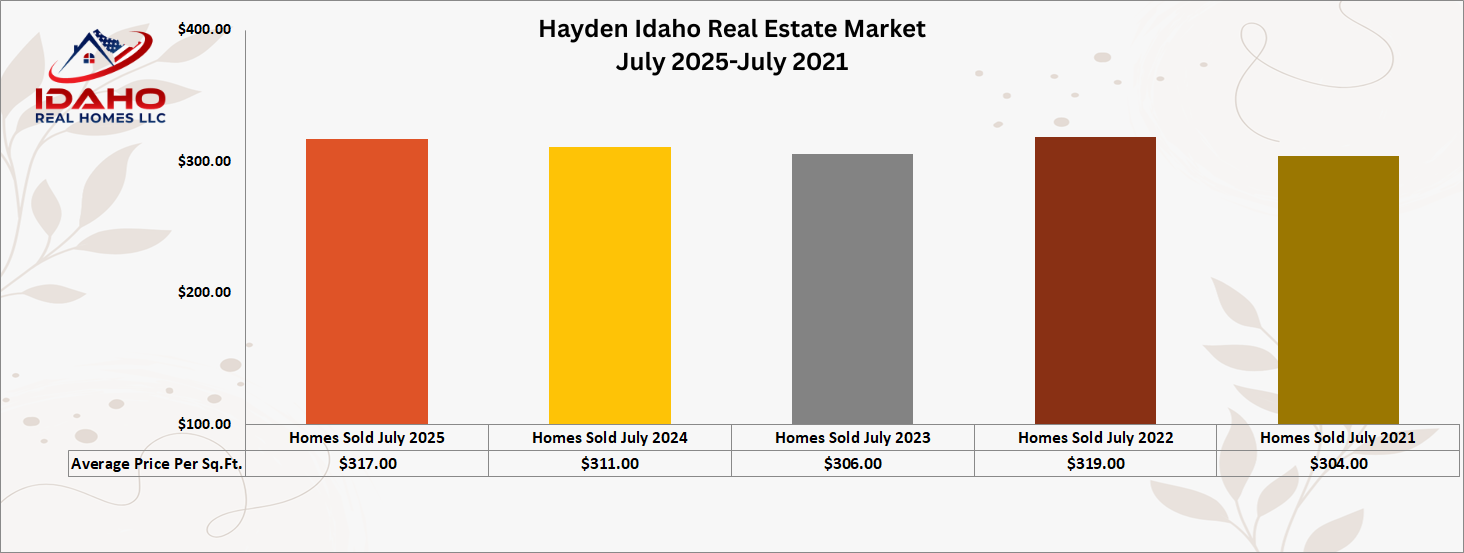
50 Homes were sold in Hayden, Idaho in July 2025 for an overall average of $317 per sq.ft. The average time on the market was 80 days and these homes sold for an average of 97% of the original listed price. The average sales price per sq.ft. is up 2% over July 2024. Volume is down 25%.
67 Homes were sold in July 2024 for an overall average of $311 per square foot. The average time on the market was 84 days and these homes sold for an average of 98% of the original listed price.
52 Homes were sold in July 2023, 50 Homes were sold in July 2022, and July 2020 had 83 home sales.
Read more below about the average sales price for Hayden new construction, existing homes, homes on land, and more! For more information about Hayden, visit our community page here!
10 New construction homes were sold in Hayden, Idaho in July 2025 for an average of $314 per sq.ft. The average lot size was 0.18 acres.
These homes sold for an average of 97% of the original listed price. The high seller of the group sold for an average of $452 per sq.ft. The low seller of the group sold for an average of $208 per sq.ft.
15 New construction homes were sold in Hayden, Idaho in July 2024 for an average of $289 per sq.ft.
6 New homes were sold in July 2023 for an average of $305 per sq.ft. 7 New homes sold in July 2022 for an average of $270 per SqFt. 8 New homes sold in July 2021 for an average of $265 per sqft. 14 New homes sold in July 2020 for an average of $181 per sqft.

8 Homes built 2018 or newer were sold in Hayden, Idaho in July 2025 for an average of $331 per sq.ft. The average time on the market was 82 days. The average lot size was 0.21 acres.
These homes sold for an average of 96% of the original listed price. The high seller of the group sold for an average of $450 per sq.ft. The low seller of the group sold for an average of $244 per sq.ft.
5 Homes built in 2018 or newer were sold in July 2024 for an average of $294 per sq.ft. The average time on the market was 68 days.
8 Homes sold in July 2023 for an average of $350 per sq.ft. Average DOM was 60. July 2022 had 4 homes sold for an average of $351 per sq.ft. Average DOM was 50. July 2021 had 6 homes sell for an average of $333 per sq.ft. Average DOM was 45. July 2020 had 6 homes sell for an average of $212 per sq.ft. Average DOM was 71.
Thinking of Selling Your Home? Request a Free Home Valuation Here!
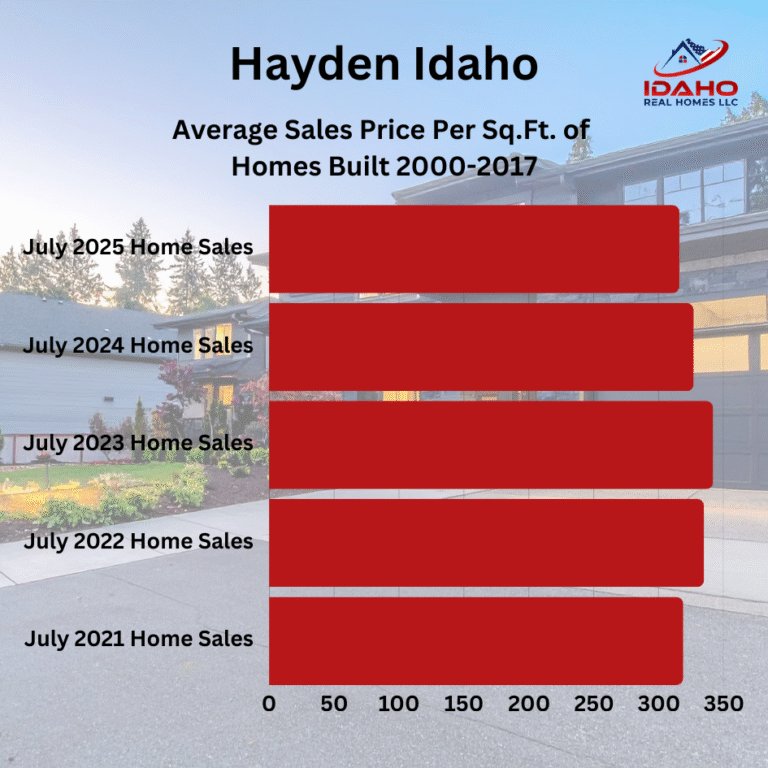
10 Homes built from 2000-2017 were sold in Hayden, Idaho in July 2025 for an average of $316 per sq.ft. The average time on the market was 68 days. The average lot size was 0.27 acres.
These homes sold for an average of 97% of the original listed price. The high seller of the group sold for an average of $416 per sq.ft. The low seller of the group sold for an average of $217 per sq.ft.
13 Homes built from 2000-2017 were sold in July 2024 for an average of $327 per sq.ft. The average time on the market was 41 days.
12 Homes sold in July 2023 for an average of $342 per sq.ft. Average DOM was 56. July 2022 had 16 homes sell for an average of $335 per sq.ft. Average DOM was 59. July 2021 had 23 homes sell for an average of $319 per sq.ft. Average DOM was 41. 24 Homes sold in July 2020 for an average of $213 per sq.ft. Average DOM was 54.
12 Homes built from 1980-1999 were sold in Hayden, Idaho in June 2025 for an average of $312 per sq.ft. The average time on the market was 49 days. The average lot size was 0.26 acres.
These homes sold for an average of 97% of the original listed price. The high seller of the group sold for an average of $434 per sq.ft. The low seller of the group sold for an average of $211 per sq.ft.
12 Homes built from 1980-1999 were sold in July 2024 for an average of $325 per sq.ft. The average time on the market was 54 days.
9 Homes sold in July 2023 for an average of $258 per sq.ft. Average DOM was 66. 11 Homes sold in July 2022 for an average of $336 per SqFt. Average DOM was 47. 12 Homes were sold in July 2021 for an average of $318 per sqft. Average DOM was 43. 17 Homes sold in July 2020 for an average of $224 per sqft. The average DOM was 45.

1 Home on an acre lot was sold in Hayden, Idaho in July 2025 for an average of $387 per sq.ft. The average time on the market was 85 days. The average size of the lot was 1 acre. This home sold for an average of 95% of the original listed price.
3 Homes on 1-acre lots were sold in July 2024 for an average of $409 per sq.ft. The average time on the market was 54 days.
2 Homes sold in July 2023 for an average of $240 per sq.ft. Average DOM was 148. 2 Homes sold in July 2022 for an average of $320 per SqFt. Average DOM was 83. 4 Homes sold in July 2021 for an average of $356 per sqft. Average DOM was 92. 6 Homes sold in July 2020 for an average of $219 per sqft & the average DOM was 69.
1 Hayden home on land was sold in July 2025 for an average of $287 per sq.ft. The average time on the market was 181 days. The average size of the lot was 4.7 acres. This home sold for an average of 93% of the original listed price.
2 Homes sold in July 2024 for an average of $353 per sq.ft. The average time on the market was 34 days. The average lot size was 6 acres.
2 Homes on 5 acre lots were sold in July 2023 for an average of $370 per sq.ft. Average DOM was 37. No July 2022 or 2021 home sales in this group. 3 Homes sold in July 2020 for an average of $199 per sqft. Average DOM was 66.
1 Home on a 10-acre lot was sold in Hayden, Idaho in July 2025 for an average of $321 per sq.ft. The average time on the market was 125 days. The average size of the lot was 10.04 acres. This home sold for an average of 96% of the original listed price.
1 Home on an average of 10 acres was sold in July 2024 for an average of $359 per sq.ft. The average time on the market was 54 days.
1 Home sold in July 2023 for an average of $702 per sq.ft. Average DOM was 121. 1 Home sold in July 2022 for an average of $300 per SqFt. Average DOM was 42. 1 Home sold in July 2021 for an average of $434 per sqft. Average DOM was 77. No July 2020 home sales w/ 10 acres.
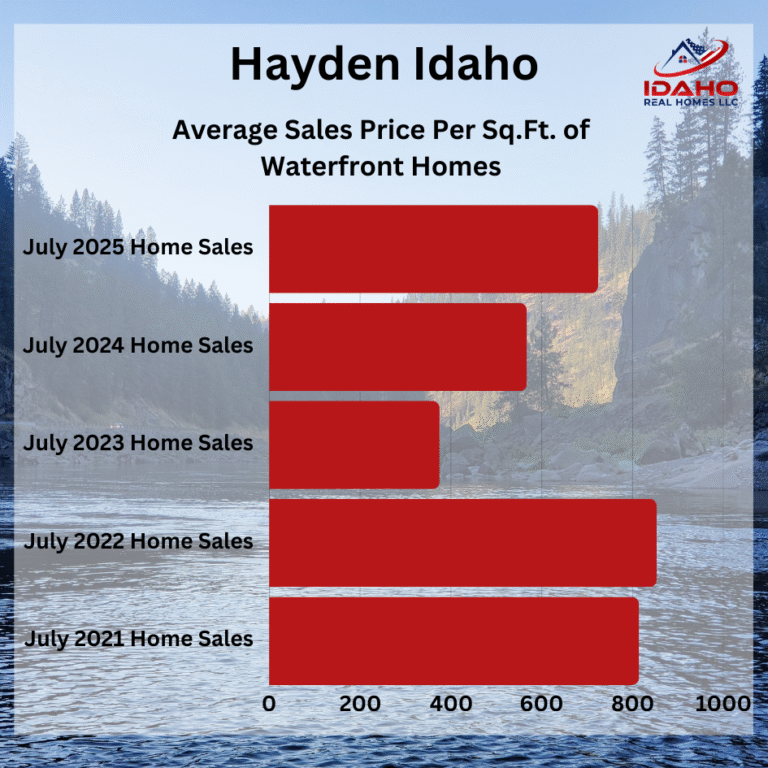
3 Waterfront homes were sold in Hayden, Idaho in July 2025 for an average of $724 per sq.ft. The average time on the market was 40 days. The average lot size was 0.6 acres.
These homes sold for an average of 98% of the original listed price. The high seller of the group sold for an average of $875 per sq.ft. The low seller of the group sold for an average of $580 per sq.ft.
5 Waterfront homes were sold in July 2024 for an average of $567 per sq.ft. The average time on the market was 109 days.
1 Waterfront home sold in July 2023 for an average of $375 per sq.ft. Average DOM was 46. 2 Waterfront homes sold in July 2022 for an average of $853 per SqFt. Average DOM was 161. 3 Waterfront homes sold in July 2021 for an average of $814 per sqft. Average DOM was 106. 3 Waterfront homes sold in July 2020 for an average of $441 per sqft & the average DOM was 86.
3 Manufactured homes on leased lots were sold in Hayden, Idaho in July 2025 for an average of $49 per sq.ft. The average time on the market was 97 days. These homes sold for an average of 76% of the original listed price.
3 Manufactured homes on leased lots were sold in July 2024 for an average of $140 per sq.ft. The average time on the market was 58 days.
2 Manufactured homes on leased lots were sold in July 2023 for an average of $83 per sq.ft. Average DOM was 135. 4 Manufactured homes on leased lots sold in July 2022 for an average of $127 per SqFt. Average DOM was 50. 6 Manufactured homes sold in July 2021 for an average of $132 per sqft. Average DOM was 37. No July 2020 mobile home sales.
1 Condo was sold in Hayden, Idaho in July 2025 for an average of $368 per sq.ft. The average time on the market was 41 days. The average size of the lot was 0.3 acres. This condo sold for an average of 100% of the original listed price.
1 Condo was sold in July 2024 for an average of $201 per sq.ft. The average time on the market was 48 days.
3 Condos were sold in July 2023 for an average of $286 per sq.ft. Average DOM was 82. 1 Condo sold in July 2022 for an average of $325 per SqFt. Average DOM was 66. 1 Condo sold in July 2021 for an average of $346 per sqft. Average DOM was 75. 1 Condo sold in July 2020 for an average of $189 per sqft. Average DOM was 80.