350 E Kathleen Ave
ste, 400
Coeur d' Alene, Id
83815
1-208-719-9010
Call or text
Mon - Fri: 9:00 - 5pm
Weekends by appointment Book your apt Here

ste, 400
Coeur d' Alene, Id
83815
Call or text
Weekends by appointment Book your apt Here

ste, 400 Coeur d' Alene, Id 83815
Call or text
Weekends by appointment
Book your apt Here
Last updated on March 29th, 2023 at 09:43 am
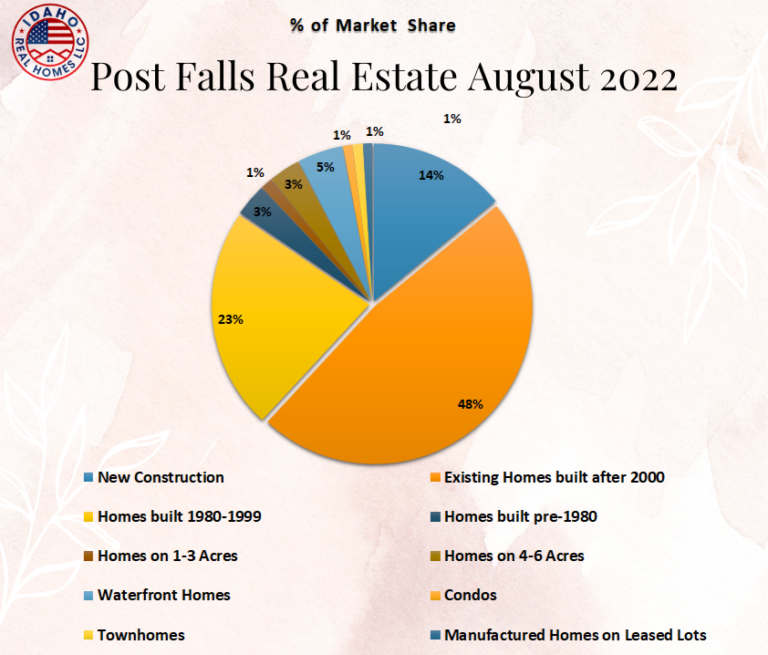
90 Homes were sold in Post Falls, Idaho in the month of August 2022 for an overall average of $293 per sq.ft., they were on the market for an average of 63 days, and sold for an average of 94% of the original listed price. The average sales price per sq.ft. of Post Falls homes is up 13% over August 2021. Volume is down 24%.
August 2021 had 118 Post Falls homes sell for an average of $258 per sq.ft., were on the market for aan average of 78 days, and sold for an average of 100% of the original listed price.
August 2020 had 160 home sales. August 2019 had 130 home sales. August 2018 had 155 home sales and August 2017 had 123 home sales.
The volume of new construction home sales has decreased by 13 homes and the average sales price has increased by $20 per SqFt compared to August 2021.
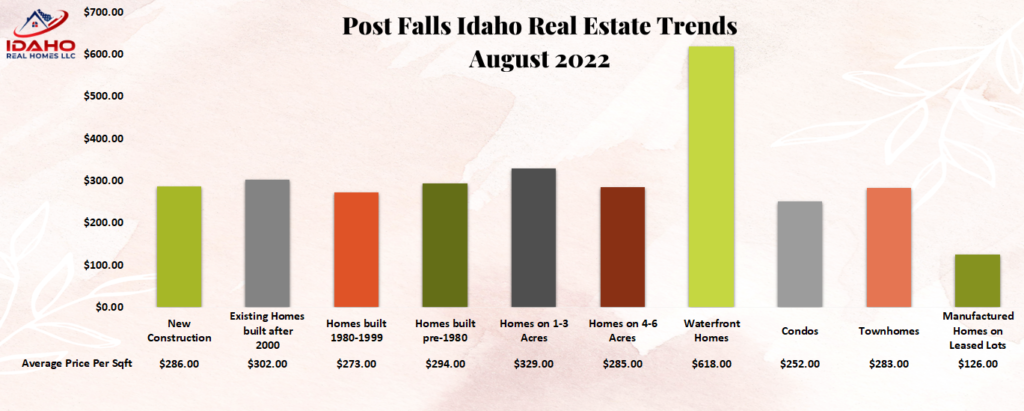
13 New construction homes were sold in Post Falls in August 2022 for an average of $286 per SqFt. The average lot size was 0.19 acres.
These homes sold for an average of 97% of the original listed price. The high seller of the group sold for an average of $399 per SqFt. The low seller of the group sold for an average of $181 per SqFt and was from the Foxtail subdivision. Home sales in this group include homes from the North Place community.
26 New construction homes sold in Post Falls, Idaho during August 2021 for an average of $266 per sqft.
30 New construction homes sold in August 2020 for an average of $191 per sqft. 48 New Construction homes were sold in August 2019 for an average of $169 per sqft. August 2018 had 43 new construction homes sell for an average of $163 per sqft.
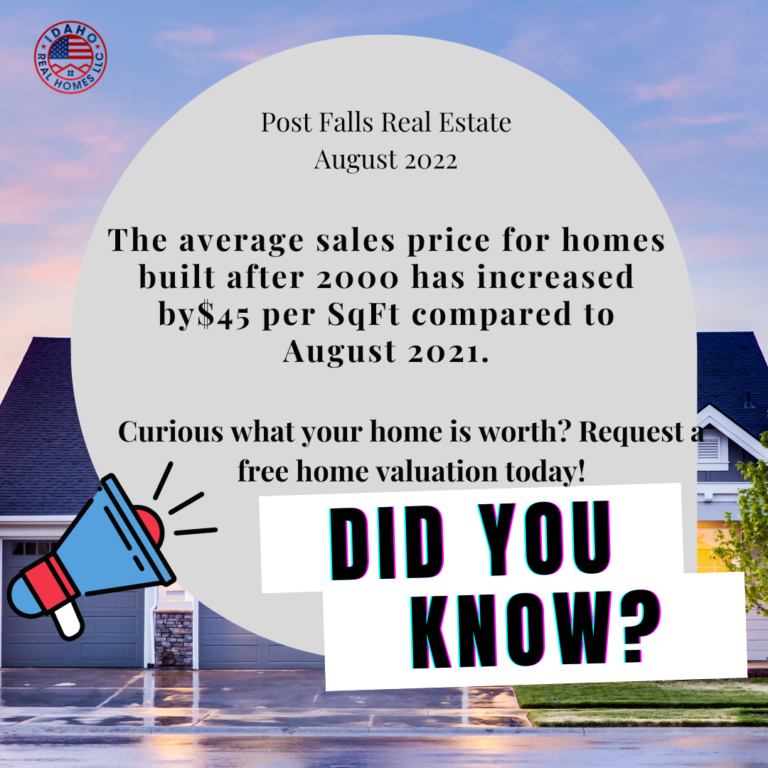

The volume of home sales in this group has decreased by 3 homes and the average sales price has increased by $45 per SqFt compared to August 2021.
42 Existing homes that were built after 2000 sold in Post Falls in August 2022 for an average of $302 per SqFt. The average time on the market was 63 days. The average lot size was 0.2 acres.
These homes sold for an average of 93% of the original listed price. The high seller of the group sold for an average of $415 per SqFt and was from the Meadow Grove subdivision. The low seller of the group sold for an average of $193 per SqFt and was from the Montrose subdivision.
Home sales in this group include homes from the Crossings; Crown Pointe; Fieldstone; Highland Park; North Place; Prairie Meadows; Tullamore and Woodbridge South communities.
45 Homes that were built after 2000 sold in August 2021 for an average of $257 per sqft. The average time on the market was 72 days.
56 Homes sold in August 2020 for an average of $201 per sqft. The average time on the market was 68 days. 34 Homes that were built in 2000 or newer were sold during August 2019 for an average of $164 per sqft. These homes spent an average of 66 days on the market. 39 Homes sold in August 2018 for an average of $149 per sqft. and the average number of days on market was 64 days.
The volume of home sales in this group has increased by 7 homes and the average sales price has increased by $7 per SqFt compared to August 2021.
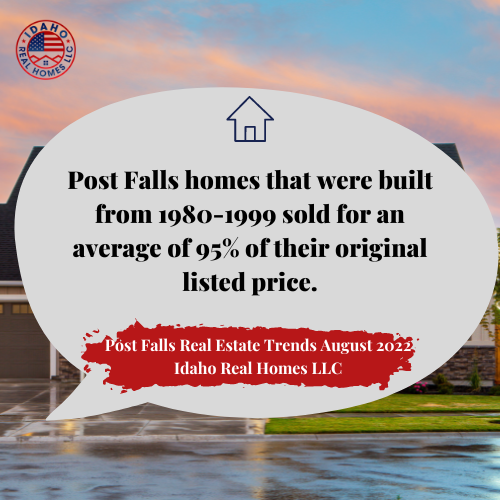
22 Homes that were built from 1980-1999 sold in Post Falls in August 2022 for an average of $273 per SqFt. The average time on the market was 51 days. The average lot size was 0.2 acres.
These homes sold for an average of 95% of the original listed price. The high seller of the group sold for an average of $397 per SqFt and was from the Singing Hills subdivision. The low seller of the group sold for an average of $195 per SqFt and was from the Quail Run subdivision.
Home sales in this group include homes from the Harmony Place; Highland Park; Pioneer Ridge; and Riverside Harbor communities.
15 Homes that were built from 1980-1999 sold in August 2021 for an average of $266 per sqft. The average time on the market was 46 days.
29 Homes that were built from 1980-1999 sold in August 2020 for an average of $188 per sqft. The average time on the market was 44 days. 18 Homes that were built between 1999-1980 were sold in August 2019 for an average of $160 per sqft and spent an average of 64 days on the market. 24 Homes sold in this age group in August 2018 for an average price of $135 per square foot and were on the market for an average of 62 days.

The volume of home sales in this group has decreased by 7 homes and the average sales price has increased by $76 per SqFt compared to August 2021.
3 Homes that were built before 1980 sold in August 2022 for an average sales price of $294 per SqFt. The average time on the market was 22 days. The average lot size was 0.3 acres.
These homes sold for an average of 94% of the original listed price. The high seller of the group sold for an average of $413 per SqFt and was from the Robert’s subdivision. The low seller of the group sold for an average of $186 per SqFt and was from the Falls River subdivision.
10 Homes that were built prior to 1980 sold in August 2021 for an average of $218 per sqft. The average time on the market was 60 days.
17 Homes that were built prior to 1980 sold in August 2020 for an average of $175 per sqft. The average time on the market was 56 days. 10 Homes that were built pre-1980 were sold in August 2019 for an average of $120 per sqft and spent an average of 46 days on the market. 13 Homes sold in August 2018 for an average price per square foot of $113 and were on the market for an average of 57 days.
The volume of home sales in this group has decreased by 3 homes and the average sales price has increased by $17 per SqFt compared to August 2021.
1 Home sold in the 1-3 acre category in Post Falls in August 2022 for an average of $329 per SqFt. The average time on the market was 19 days. The average size of the lot was 0.93 acres. This home sold for an average of 98% of the original listed price and was from the Prairie Meadows subdivision.
4 Homes sold in the 1-3 acre in August 2021 for an average of $312 per sqft. The average time on the market was 131 days.
3 Homes sold in August 2020 for an average of $149 per sqft. The average time on the market was 50 days. 1 home sold in the 1-3 acre category in August 2019 for an average of $193 per sqft and it spent an average of 36 days on the market. August 2018 had 7 homes sell in this group for an average of $170 per sqft. and the average time on the market was 41 days.
The volume of home sales in this group has decreased by 4 homes and the average sales price for existing homes has increased by $6 per SqFt compared to August 2021.
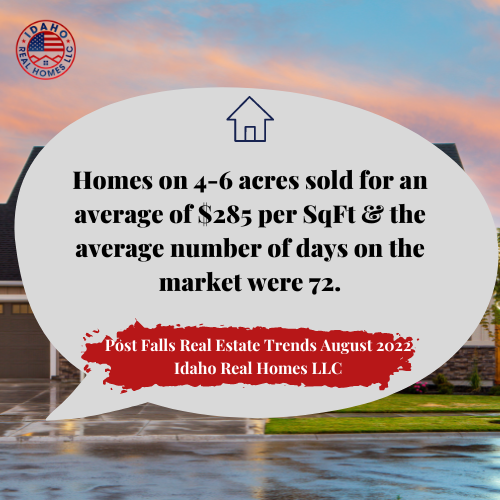
3 Homes sold in the 4-6 acre group in August 2022 for an average of $285 per SqFt. The average time on the market was 72 days. The average lot size was 4.7 acres.
These homes sold for an average of 80% of the original listed price. The high seller of the group sold for an average of $306 per SqFt and was from the Green Acres Addition subdivision. The low seller of the group sold for an average of $244 per SqFt.
August 2021 had 7 homes on 4-6 acres sell: 1 new construction sold for an average of $322 per SqFt and 6 existing homes sold for an average of $279 per SqFt. The average time on the market was 163 days.
6 Homes sold in August 2020 for an average of $221 per sqft. The average time on the market was 98 days. 4 Homes were sold in August 2019 for an average of $173 per sqft and spent an average of 88 days on the market. August 2018 had 3 homes sell for an average of $171 per sqft. and the average time on the market was 74 days.
There were no home sales on 6-10 acres in Post Falls, Idaho in the month of August 2022.
1 Home sold in the 6-10 acre group in August 2021 for an average of $369 per sqft. The average time on the market was 173 days.
No August 2020 home sales in this group. 1 Home sold in the 6-10 acre category in August 2019 for an average of $352 per sqft and spent an average of 59 days on the market. August 2018 had 3 homes sell for an average of $191 per sqft. and the average time on the market was 184 days.
There were no home sales with over 10 acres in Post Falls in August 2022.
No August 2021 home sales in this group.
2 Homes sold in this group in Post Falls Idaho during August 2020 for an average of $165 per sqft. The average time on the market was 350 days. No home sales during August 2019, or August 2018.
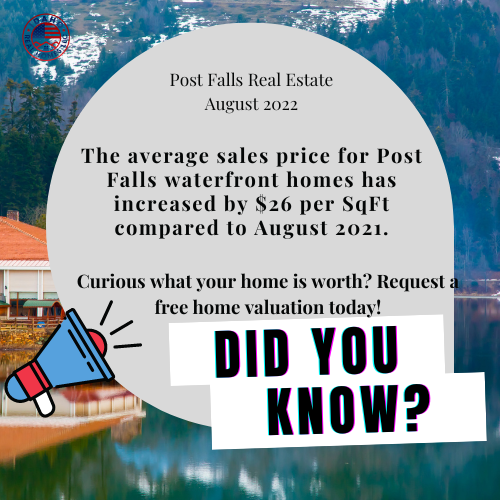
The volume of waterfront home sales has remained the same and the average sales price has increased by $26 per SqFt compared to August 2021.
2 Waterfront homes were sold in Post Falls in August 2022. The average sales price was $618 per SqFt. The average time on the market was 63 days. The average lot size was 1.8 acres.
These homes sold for an average of 96% of the original listed price. The high seller of the group sold for an average of $732 per SqFt and was from the Riverside Harbor subdivision. The low seller of the group sold for an average of $503 per SqFt and was from the Rivertime Estates.
2 Waterfront homes sold in August 2021 for an average of $592 per sqft. The average time on the market was 189 days.
6 Waterfront homes sold in August 2020 for an average of $349 per sqft. The average time on the market was 76 days. 4 Waterfront homes sold in August 2019 for an average of $280 per sqft and spent an average of 82 days on the market. August 2018 had 2 homes sell for an average of $292 per sqft. and the average time on the market was 271 days.
The volume of Post Falls condo sales has decreased by 3 homes and the average sales price for existing condos has increased by $12 per SqFt compared to August 2021.
1 Condo sold in August 2022 for an average of $252 per SqFt. The average time on the market was 83 days. The average size of the lot was 0.06 acres. This condo sold for an average of 81% of the original listed price.
August 2021 had 4 condos sell in Post Falls: 1 waterfront condo sold for an average of $499 per SqFt & spent an average of 23 days on the market and 3 existing condos sold for an average of $240 per SqFt and spent an average of 44 days on the market.
9 Condos sold in August 2020 for an average of $244 per sqft. The average time on the market was 55 days. 4 Condos sold in August 2019 for an average of $167 per sqft and they spent an average of 50 days on the market. 5 Condos sold in August 2018 for an average price per square foot of $142. The average days on the market were 42 days.
1 Townhome sold in Post Falls in August 2022 for an average of $283 per SqFT. The average time on the market was 51 days. The average lot size was 0.13 acres. This townhome sold for an average of 90% of the original listed price and was from the Treaty Rock subdivision.
No Post Falls townhome sales to compare to in August 2021, 2020, 2019, 2018, or 2017.
The volume of Post Falls mobile home sales has decreased by 2 homes and the average sales price has increased by $31 per SqFt compared to August 2021.
2 Manufactured homes on leased lots sold in Post Falls, Idaho in August 2022 for an average of $126 per SqFt. The average time on the market was 25 days.
These mobile homes sold for an average of 97% of the original listed price. The high seller of the group sold for an average of $161 per SqFt and was from the Camelot Estates. The low seller of the group sold for an average of $92 per SqFt and was from Arundel Park.
4 Manufactured homes on leased lots sold in August 2021 for an average of $95 per sqft. The average time on the market was 43 days.
1 Manufactured home on a leased lot sold in August 2020 for an average of $98 per sqft. The average time on the market was 33 days. 3 Manufactured homes on leased lots sold in August 2019 for an average of $54 per sqft and the average time spent on the market was 66 days. 2 Manufactured homes sold in August 2018 for an average price of $58 per square foot and were on the market for an average of 25 days.
