
350 E Kathleen Ave
ste, 400
Coeur d' Alene, Id
83815
1-208-719-9010
Call or text
Mon - Fri: 9:00 - 5pm
Weekends by appointment Book your apt Here

ste, 400
Coeur d' Alene, Id
83815
Call or text
Weekends by appointment Book your apt Here

ste, 400 Coeur d' Alene, Id 83815
Call or text
Weekends by appointment
Book your apt Here
Last updated on October 24th, 2022 at 01:23 pm
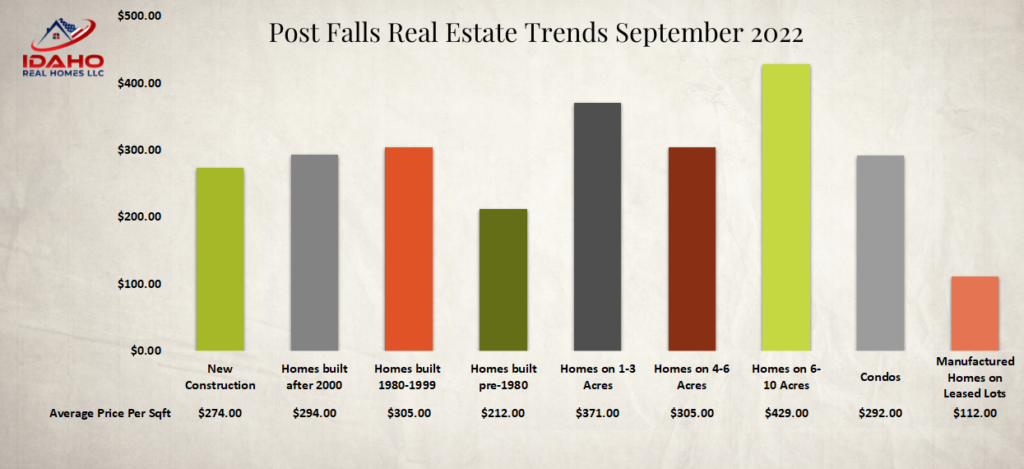
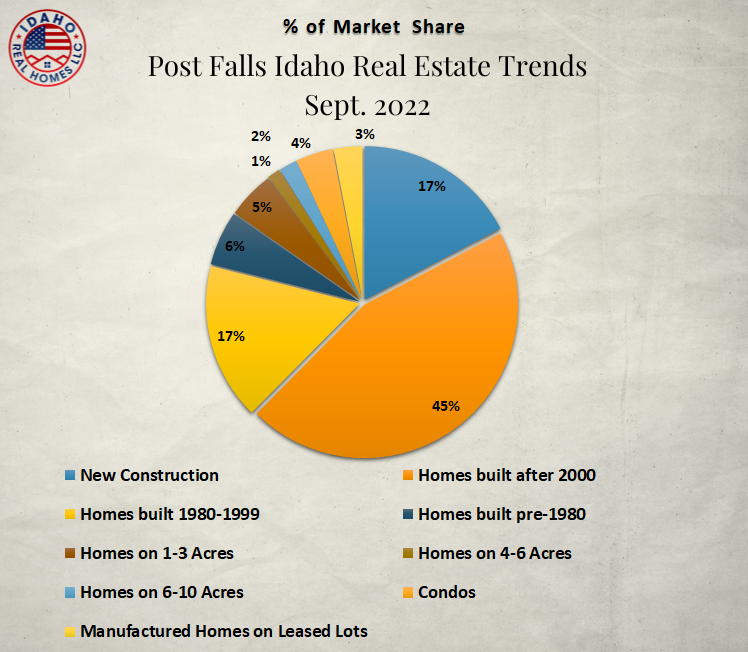
Here are the latest housing market trends for Post Falls, Idaho! 80 Homes were sold in Post Falls, Idaho in September 2022. The home sales volume has decreased by 35 homes compared to September 2021 which had 115 home sales.
September 2020 had 130 home sales. September 2019 had 135 home sales. September 2018 had 130 home sales, and September 2017 had 119 home sales.
The volume of home sales in this group has decreased by 8 homes and the average sales price has increased by $5 per SqFt compared to September 2021.
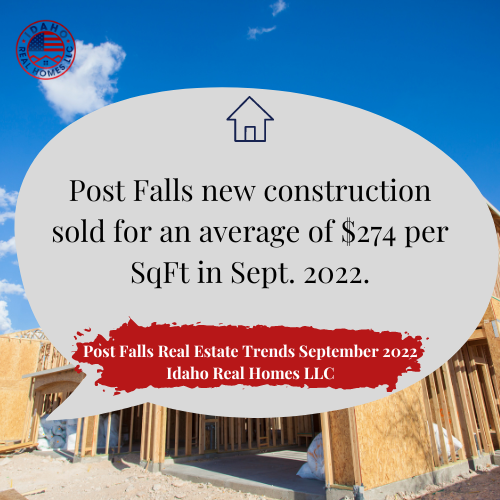
14 New construction homes were sold in Post Falls in September 2022 for an average of $274 per SqFt. The average lot size was 0.2 acres.
These homes sold for an average of 97% of the original listed price. The high seller of the group sold for an average of $354 per SqFt and was from the Pradera subdivision. The low seller of the group sold for an average of $180 per SqFt and was from the Foxtail subdivision.
Home sales in this group include homes from the North Place community.
22 New construction homes sold in September 2021 for an average of $269 per sqft.
34 New construction homes sold in September 2020 for an average of $181 per sqft. 35 New construction homes sold in September of 2019 for an average of $161 per sqft. September 2018 had 33 new homes sell for an average of $150 per sqft. September 2017 had 31 new construction homes sell for an average price per square foot of $133.

The volume of home sales in this group has decreased by 4 homes and the average sales price has increased by $25 per SqFt compared to September 2021.
34 Existing homes that were built after 2000 sold in September 2022 for an average of $294 per SqFt. The average time on the market was 61 days. The average lot size was 0.2 acres.
These homes sold for an average of 95% of the original listed price. The high seller of the group sold for an average of $451 per SqFt and was from the St Andrews Court subdivision. The low seller of the group sold for an average of $197 per SqFt and was from the Tullamore subdivision.
Home sales in this group include homes from the Prairie Falls; Riverside Harbor; Woodbridge South; Montrose; Fieldstone; Crossings; Tullamore; North Place; and Crown Pointe communities.
38 Homes built after 2000 sold in September 2021 for an average of $269 per sqft. The average time on the market was 87 days.
42 Homes that were built after 2000 sold in September 2020 for an average of $217 per sqft. The average time on the market was 46 days. September 2019 had 50 homes sell for an average of $162 per sqft. and the average time on the market was 60 days. 42 Homes sold in September 2018 for an average price per square foot of $152 and were on the market for an average of 65 days.
The volume of home sales in this group has decreased by 13 homes and the average sales price has increased by $25 per SqFt compared to September 2021.
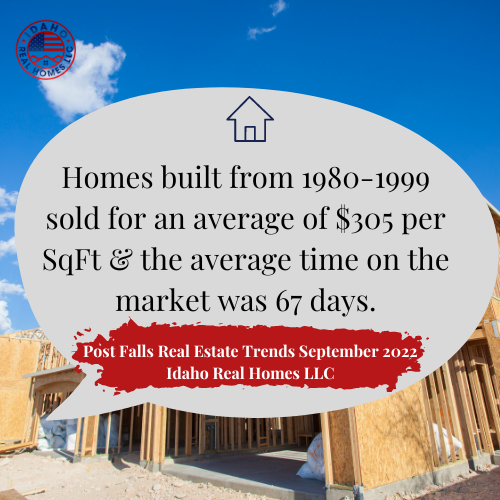
12 Post Falls homes that were built from 1980-1999 sold in September 2022 for an average of $305 per SqFt. The average time on the market was 67 days. The average lot size was 0.2 acres.
These homes sold for an average of 100% of the original listed price. The high seller of the group sold for an average of $390 per SqFt. The low seller of the group sold for an average of $214 per SqFt and was from the Pinevilla subdivision.
Home sales in this group include homes from the Prairie Falls; Pioneer Ridge; and Riverside Harbor communities.
25 Homes built 1980-1999 sold in September 2021 for an average of $280 per sqft. The average time on the market was 46 days.
22 Homes built from 1980-1999 sold in September 2020 for an average of $195 per sqft. The average time on the market was 48 days. 25 Homes sold in September 2019 for an average of $162 per sqft. and spent an average of 55 days on the market. 22 Homes sold in September 2018 for an average price per square foot of $142 and were on the market for an average of 68 days.

The volume of home sales in this group has decreased by 10 homes and the average sales price has decreased by $5 per SqFt compared to September 2021.
6 Homes that were built prior to 1980 sold in September 2022 for an average of $212 per SqFt. The average time on the market was 75 days. The average lot size was 0.35 acres.
These homes sold for an average of 93% of the original listed price. The high seller of the group sold for an average of $249 per SqFt and was from the Pleasant View subdivision. The low seller of the group sold for an average of $144 per SqFt and was from the Pinevilla subdivision.
16 Homes built pre-1980 sold in September 2021 for an average of $217 per sqft. and the average time on the market was 68 days.
16 Homes that were built prior to 1980 sold in September 2020 for an average of $150 per sqft. The average time on the market was 45 days. 12 Homes sold in September of 2019 for an average of $138 per sqft. The average time on the market was 62 days. 7 Homes sold in September of 2018 for an average price per square foot of $103 and were on the market for an average of 176 days.
3 Homes sold in the 1-3 acre group in September 2022 for an average of $371 per SqFt. The average time on the market was 37 days. The average lot size was 1.3 acres.
These homes sold for an average of 94% of the original listed price. The high seller of the group sold for an average of $433 per SqFt. The low seller of the group sold for an average of $326 per SqFt and was from The Meadows subdivision.
No September 2021 home sales in this group.
2 Homes sold in September 2020 for an average of $213 per sqft. The average time on the market was 62 days. 1 Home sold in September 2019 for an average of $241 per sqft. and spent an average of 81 days on the market. 3 Homes sold in September 2018 for an average of $134 per sqft. and spent an average of 142 days on the market. September 2017 had one home sold for an average of $157 per sqft. and spent an average of 111 days on the market.
The volume of home sales in this group has dropped by 3 homes and the average sales price has decreased by $45 per SqFt compared to September 2021.
1 Home on an average of 5 acres sold in Post Falls in September 2022 for an average of $305 per SqFt. The average time on the market was 82 days. This home sold for an average of 80% of the original listed price.
4 Homes sold in the 4-6 acre group in September 2021 for an average of $350 per sqft. The average time on the market was 282 days.
4 Homes sold in September 2020 for an average of $301 per sqft. The average time on the market was 72 days. 3 Homes sold in September 2019 for an average of $198 per sqft. The average time on the market was 57 days. 3 Home sales in September 2018 for an average price per square foot of $178 and an average of 75 days on the market. September 2017: 3 homes sold (2 manufactured homes) they sold for an average price of $162 per sq ft. 82 days on the market on average.
The volume of Post Falls home sales in this group has remained the same and the average sales price has increased by $137 per SqFt compared to September 2021.
1 Home sold in the 6-10 acre group in September 2022 for an average of $429 per SqFt. The average time on the market was 48 days. The average lot size was 7.3 acres.
This home sold for an average of 90% of the original listed price and was from the Finneman subdivision.
1 Home sold in September 2021 for an average of $292 per sqft. The average time on the market was 62 days.
No home sales in the 6-10 acre group in September 2020. No home sales during September 2019 in Post Falls, Idaho. No September 2018 Sales. September 2017 2 homes sell for an average price per sqft of $120 and spent an average of 107 days on the market.
There were no home sales with over 10 acres in Post Falls in September 2022.
No home sales in this group in September 2021.
No home sales in this group during September 2020, 2019, 2018, or 2017.
No waterfront home sales in September 2022.
2 Waterfront homes sold in September 2021 for an average of $282 per sqft. The average time on the market was 148 days.
6 Waterfront homes sold in September 2020 for an average of $442 per sqft. The average time on the market was 89 days. 1 Waterfront home sold in September of 2019 for an average of $290 per sqft. and spent an average of 71 days on the market. September 2018: 6 homes sold for an average of $283 per sqft. and spent an average of 146 days on the market. September 2017 had no waterfront home sales.
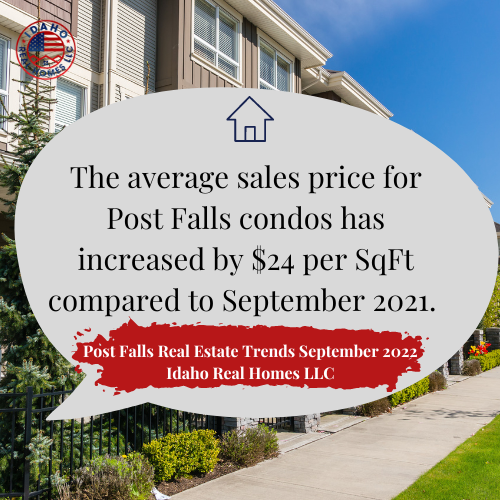
The volume of Post Falls condo sales has increased by one home and the average sales price has increased by $24 per SqFt compared to September 2021.
3 Condos sold in September 2022 for an average of $292 per SqFt. The average time on the market was 46 days. The average lot size was 0.09 acres.
These homes sold for an average of 100% of the original listed price. The high seller of the group sold for an average of $308 per SqFt and was from the Greenview Condos. The low seller of the group sold for an average of $279 per SqFt and was from the Riverwalk Condos.
2 Condos sold in September 2021 for an average of $268 per sqft. and the average time on the market was 80 days.
1 Townhome sold in September 2020 for an average of $192 per sqft. The average time on the market was 41 days. 3 Condos sold in September 2019 for an average of $165 per sqft. and spent an average of 44 days on the market. 4 condos sold in September 2018 for an average price per square foot of $143 and averaged 44 days on the market. In September 2017 3 condos sold for an average price per square foot of $144 and were on the market for an average of 60 days.
The volume of mobile home sales has increased by one home and the average sales price has increased by $18 per SqFt compared to September 2021.
6 Manufactured homes on rented lots were sold in September 2022 for an average of $112 per SqFt. The average time on the market was 59 days.
These mobile homes sold for an average of 79% of the original listed price. The high seller of the group sold for an average of $161 per SqFt. The low seller of thegroup sold for an average of $40 per SqFt and was from the Chateau Park.
5 Manufactured homes on leased lots sold in September 2021 for an average of $94 per sqft. The average time on the market was 49 days.
2 Manufactured homes sold in September 2020 for an average of $55 per sqft. The average time on the market was 30 days. 5 Manufactured homes sold in September 2019 for an average of $50 per sqft. and spent an average of 52 days on the market. 2 Manufactured homes sold in September 2018 for an average price per SqFt of $36 and spent an average of 42 days on the market. September 2017 had 3 manufactured homes sell for an average price per sqft of $32 with 48 days on the market.