
350 E Kathleen Ave
ste, 400
Coeur d' Alene, Id
83815
1-208-719-9010
Call or text
Mon - Fri: 9:00 - 5pm
Weekends by appointment Book your apt Here

ste, 400
Coeur d' Alene, Id
83815
Call or text
Weekends by appointment Book your apt Here

ste, 400 Coeur d' Alene, Id 83815
Call or text
Weekends by appointment
Book your apt Here
Last updated on January 16th, 2023 at 02:47 pm
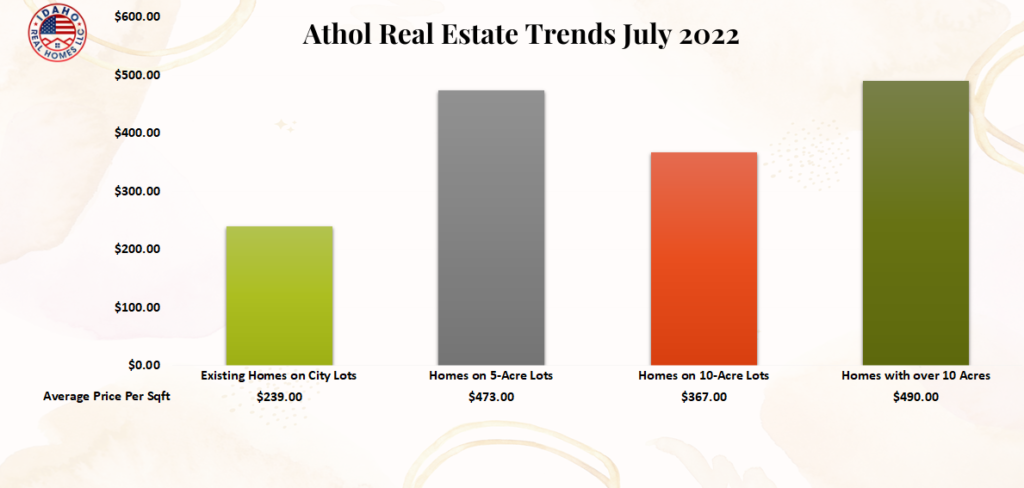
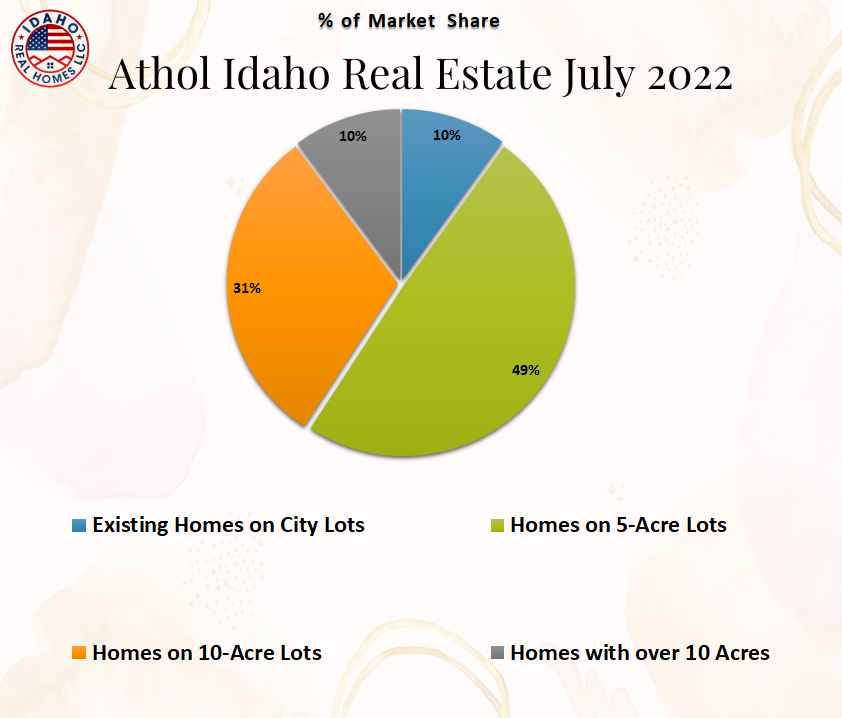
For this month’s real estate news, 11 homes were sold in Athol, Idaho. The volume of home sales has decreased by 3 homes compared to July 2021 which had 14 home sales. July 2020 had 17 home sales, July 2019 had 13 home sales, July 2018 had 15 home sales, and July 2017 had 11 home sales.
No new construction sales on city lots in Athol in the month of July 2022.
1 New construction home on a city lot sold in July 2021 for an average of $326 per SqFt. The average size of the lot was 0.33 acres.
All new home sales in July 2020, 2019, 2018, and 2017 were on acreage.
The volume of existing home sales o city lots has decreased by 2 homes and the average sales price has increased by $11 per SqFt compared to July 2021.
2 Existing homes on city lots sold in Athol in July 2022 for an average of $239 per SqFt. The average time on the market was 57 days. The average lot size was 0.4 acres.
These homes sold for an average of 93% of the original listed price. The high seller of the group sold for an average of $247 per SqFt & was from the Pine Tree subdivision. The low seller of the group sold for an average of $230 per SqFt.
4 Existing homes on city lots sold in July 2021 for an average of $228 per SqFt & the average time on the market was 58 days.
No July 2020 home sales. July 2019 had 1 home on a city lot sell for an average of $66 per SqFt & the average time on the market was 104 days. July 2018 had 2 homes sell for an average of $126 per SqFt & the average time on the market was 26 days. No July 2017 home sales.
No July 2022 home sales in this group.
July 2021 had 1 home sell for an average of $346 per SqFt & the average time on the market was 40 days.
No home sales in this group in July 2020, 2019, 2018 or 2017.

The volume of home sales in this group has remained the same and the average sales price for existing homes has increased by $89 per SqFt compared to July 2021.
5 Homes were sold in the 5-acre group in July 2022 for an average of $473 per SqFt & the average time on the market was 91 days. The average lot size was 5 acres.
These homes sold for an average of 96% of the original listed price. The high seller of the group sold for an average of $574 per SqFt. The low seller of the group sold for an average of $386 per SqFt.
July 2021 had 5 homes sold: 1 new construction sold for an average of $228 per SqFt & 4 existing homes sold for an average of $384 per SqFt and the average time on the market was 40 days.
July 2020 had 14 homes sold: 3 new construction for an average of $258 per SqFt & 11 existing homes for an average of $238 per SqFt and the average days on the market was 93. July 2019 had 8 homes sell: 1 new for an average of $244 per SqFt & 7 existing homes for an average of $190 per SqFt, DOM was 84. July 2018 had 8 homes sell: 2 new for an average of $247 per SqFt & 6 existing for an average of $185 per SqFt, DOM was 75. July 2017 had 8 homes sell: 3 new for an average of $186 per SqFt & 5 existing for an average of $182 per SqFt.
The volume of home sales in this group has increased by one home and the average sales price has increased by $129 per SqFt compared to July 2021.
3 Homes sold in the 10-acre group in Athol in the month of July 2022 for an average of $479 per SqFt. The average time on the market was 37 days. The average lot size was 10 acres.
These homes sold for an average of 100% of the original listed price. The high seller of the group sold for an average of $591 per SqFt. The low seller of the group sold for an average of $388 per SqFt.
2 Homes sold in the 10-acre group in July 2021 for an average of $350 per SqFt & the average days on the market were 125.
July 2020 had 1 home sell for an average of $348 per SqFt and the average DOM was 87. July 2019 had 2 homes sell for an average of $247 per SqFt & the average DOM was 53. July 2018 had 2 homes sell for an average of $294 per SqFt and the average DOM was 72. July 2017 had 1 home sell for an average of $220 per SqFt and the average DOM was 72.


The volume of home sales in this group has remained the same and the average sales price has decreased by $1 per SqFt compared to July 2021.
1 Home with over 10 acres sold in Athol in July 2022 for an average of $384 per SqFt. The average time on the market was 73 days. The average lot size was 28 acres. This home sold for an average of 82% of the original listed price.
1 Home with over 10 acres sold in July 2021 for an average of $385 per SqFt & the average time on the market was 38 days. The average lot size was 20 acres.
July 2020 had 1 home sell for an average of $212 per SqFt & the average time on the market was 36 days. July 2019 had 2 homes sell for an average of $341 per SqFt & the average time on the market was 43 days. July 2018 had 1 home sell for an average of $258 per SqFt & the average time on the market was 63 days.
No July 2022 waterfront home sales.
No July 2021 Athol waterfront home sales.
July 2020 had 1 waterfront home sell for an average of $198 per SqFt and the average time on the market was 35 days. No July 2019, 2018, or 2017 waterfront home sales in Athol.
Free No Obligation Home Valuation Here
[ess_grid alias=”marketreports”][/ess_grid]