
350 E Kathleen Ave
ste, 400
Coeur d' Alene, Id
83815
1-208-719-9010
Call or text
Mon - Fri: 9:00 - 5pm
Weekends by appointment Book your apt Here

ste, 400
Coeur d' Alene, Id
83815
Call or text
Weekends by appointment Book your apt Here

ste, 400 Coeur d' Alene, Id 83815
Call or text
Weekends by appointment
Book your apt Here
Last updated on March 27th, 2023 at 02:19 pm
16 Homes were sold in Spirit Lake, Idaho in July 2022. Overall, Spirit Lake homes sold for an average of $379 per sq.ft., were on the market for an average of 88 days, and sold for an average of 98% of the original listed price. The average sales price per square foot is up 26% over July 2022. Volume is consistent with last year.
July 2021 had 16 homes sell in Spirit Lake, Idaho for an overall average of $300 per sq.ft., they were on the market for an average of 63 days, and sold for an average of 103% of the original listed price.
July 2020 had 30 home sales, July 2019 had 12 home sales, July 2018 had 11 home sales, and July 2017 had 30 home sales.
If you would like more information about Spirit Lake, Idaho including previous market reports, check out our Spirit Lake Real Estate page here!
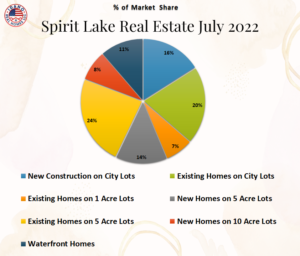
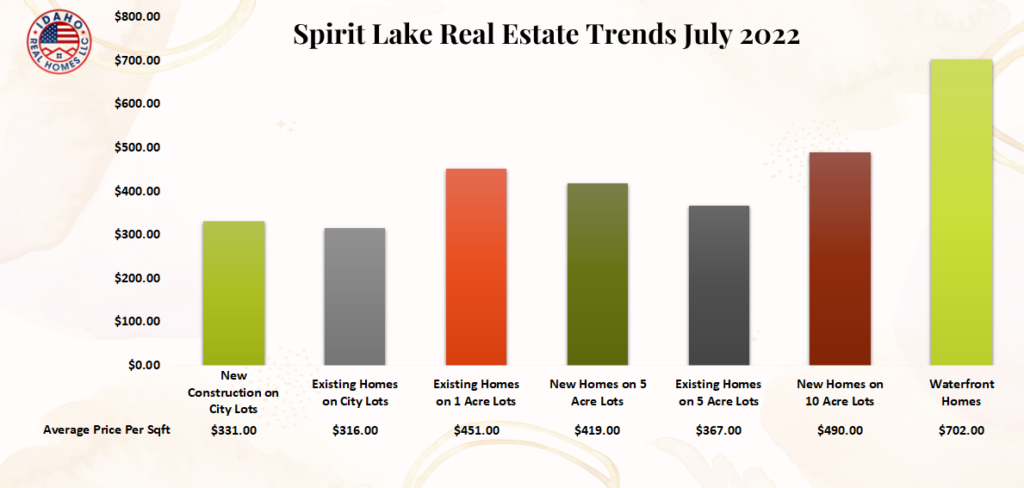
3 New construction homes on city lots sold in July 2022 for an average of $331 per SqFt. The average lot size was 0.16 acres.
These homes sold for an average of 96% of the original listed price and were from the Lakeview Spirit Lake subdivision. The high seller of the group sold for an average of $342 per SqFt. The low seller of the group sold for an average $316 per SqFt.
No new home sales on city lots in July 2021.
July 2020 had 4 new homes sell for an average of $207 per SqFt. No July 2019 home sales. July 2018 had 1 new home sell for an average of $145 per SqFt.

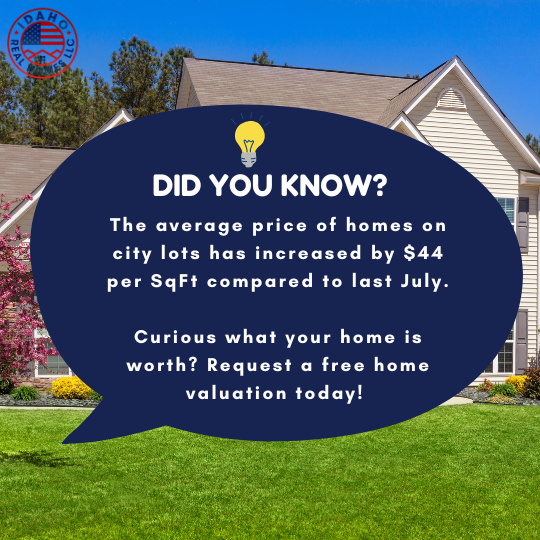
The volume of home sales in this group has decreased by 3 homes & the average sales price has increased by $44 per SqFt compared to July 2021.
4 Existing homes on city lots sold in July 2022 for an average of $316 per SqFt. The average time on the market was 46 days. The average lot size was 0.28 acres.
These homes sold for an average of 102% of the original listed price. The high seller of the group sold for an average of $442 per SqFt. The low seller of the group sold for an average of $198 per SqFt.
July 2021 had 7 homes sell for an average of $272 per SqFt & the average time on the market was 47 days.
July 2020 had 9 homes sell for an average of $208 per SqFt & the average DOM was 83. July 2019 had 6 homes sell for an average of $149 per SqFt & the average DOM was 47. July 2018 had 6 homes sell for an average of $184 per SqFt. July 2017 had 9 homes sell for an average of $115 per SqFt & average DOM was 72.
The volume of home sales in the 1-acre group has remained the same and the average sales price has increased by $294 per sqFt compared to July 2021.
1 Home sold in the 1-acre group in July 2022 for an average of $451 per SqFt. The average time on the market was 41 days. The average size of the lot was 1.08 acres.
This home sold for an average of 91% of the original listed price and was from the Spirit Lake 1st subdivision.
July 2021 had 1 home sell for an average of $157 per SqFt & the average time on the market was 50 days.
July 2020 had 3 homes sell for an average of $235 per SqFt & the average DOM was 52. No July 2019 or 2018 home sales on 1-acre. July 2017 had 1 home sell for an average of $105 per SqFt & average DOM was 68.
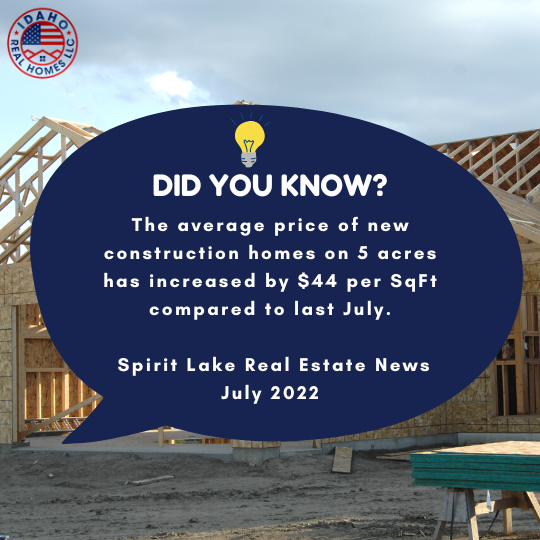
The volume of new construction homes on 5-acre lots has increased by one home & the average sales price has increased by $44 per SqFt compared to July 2021.
2 New construction homes on 5-acre lots sold in July 2022 for an average of $419 per SqFt.
These homes sold for an average of 102% of the original listed price and are from the Quail Ridge subdivision. The high seller of the group sold for an average of $465 per SqFt. The low seller of the group sold for an average of $372 per SqFt.
1 New construction home sold in July 2021 for an average of $375 per SqFt.
July 2020 had 1 new construction home sell for an average of $274 per SqFt.
The volume of home sales in this group has increased by 3 homes and the average sales price has decreased by $133 per SqFt compared to July 2021.
4 Existing homes on 5-acre lots sold in July 2022 for an average of $367 per SqFt. The average time on the market was 57 days. The average lot size was 5.6 acres.
These homes sold for an average of 94% of the original listed price. The high seller of the group sold for an average of $506 per SqFt & was from the Quail Ridge subdivision. The low seller of the group sold for an average of $280 per SqFt & was from the Edgemere Estates.
July 2021 had 1 home sell for an average of $500 per SqFt & the average time on the market was 66 days.
July 2020 had 3 homes sell for an average of $223 per SqFt & the average DOM was 71. July 2019 had 2 homes sell for an average of $206 per SqFt & the average DOM was 82. No July 2018 home sales. July 2017 had 2 homes sell for an average of $188 per SqFt & the average DOM was 107.

1 New construction home sold in the 10-acre group in July 2022 for an average of $490 per SqFt. The average size of the lot was 10.2 acres. This home sold for an average of 99% of the original listed price and was from the Spirit Lake East subdivision.
1 Existing home sold in the 10-acre group in July 2021 for an average of $151 per SqFt. The average time on the market was 30 days.
July 2020 had 5 homes sell for an average of $216 per SqFt & the average DOM was 99. July 2019 had 2 homes sell for an average of $208 per SqFt & the average DOM was 55. July 2018 had 3 homes sell for an average of $157 per SqFt & the average DOM was 49.
No July 2022 home sales in this group.
July 2021 had 2 homes with over 10 acres sell for an average of $303 per SqFt. The average DOM was 61.
July 2020 had 3 homes sell for an average of $211 per SqFt & the average DOM was 90. July 2019 had 2 homes sell for an average of $203 per SqFt & the average DOM was 103.
The volume of waterfront home sales has decreased by 2 homes and the average sales price has increased by $277 per SqFt compared to July 2021.
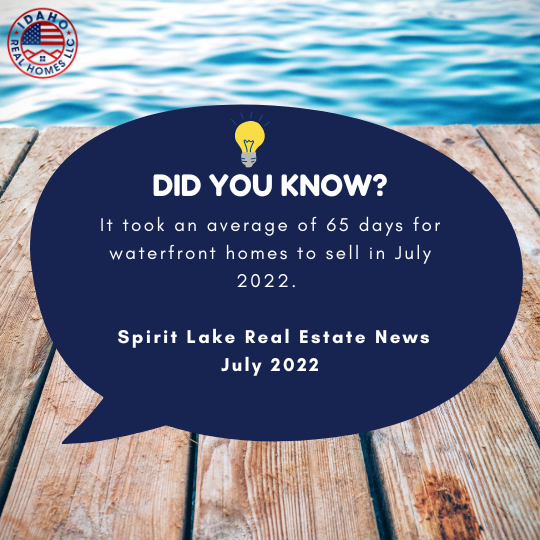
1 Waterfront home sold in July 2022 for an average of $702 per SqFt. The average time on the market was 65 days. The average size of the lot was 0.32 acres. This home sold for an average of 94% of the original listed price.
July 2021 had 3 waterfront homes sell for an average of $425 per SqFt & the average DOM was 47.
July 2020 had 2 waterfront homes sell for an average of $466 per SqFt & the average DOM was 54. No July 2019 waterfront home sales. July 2018 had 1 waterfront home sell for an average of $355 per SqFt & the average DOM was 23. July 2017 had 2 waterfront homes sell for an average of $250 per SqFt & the average DOM was 150.
Free No Obligation Home Valuation Here
[ess_grid alias=”marketreports”][/ess_grid]