
350 E Kathleen Ave
ste, 400
Coeur d' Alene, Id
83815
1-208-719-9010
Call or text
Mon - Fri: 9:00 - 5pm
Weekends by appointment Book your apt Here

ste, 400
Coeur d' Alene, Id
83815
Call or text
Weekends by appointment Book your apt Here

ste, 400 Coeur d' Alene, Id 83815
Call or text
Weekends by appointment
Book your apt Here
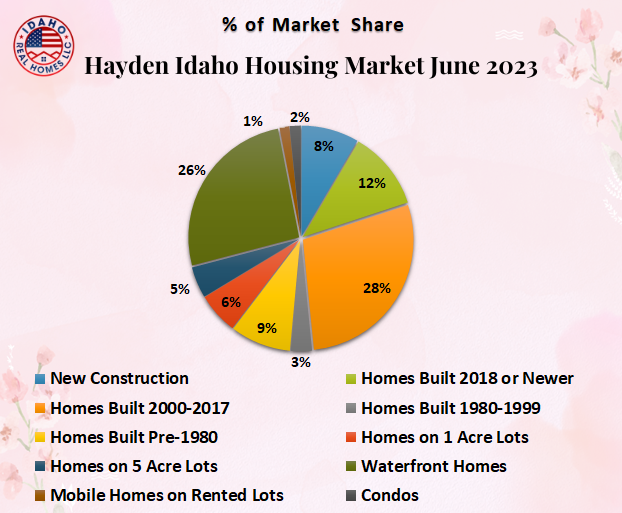
53 Homes sold in Hayden, Idaho in June 2023 for an overall average of $325 per sq.ft. (homes on less than an acre.) They were on the market for an average of 86 days and sold for an average of 97% of the original listed price. The average sales price per sq.ft. is down 2%. Volume is down 4%.
55 Homes sold in June 2022 for an overall average of $332 per square foot, were on the market for an average of 62 days and sold for an average of 97% of the original listed price.
June 2021 had 63 home sales, June 2020 had 74 home sales, June 2019 had 63 home sales, and June 2018 had 71 home sales in Hayden, Idaho.
Read more below in the Hayden housing market report for the average sales price for new construction, homes on city lots (by age), homes on land, waterfront, and more.
For more information about Hayden, visit our community page here!
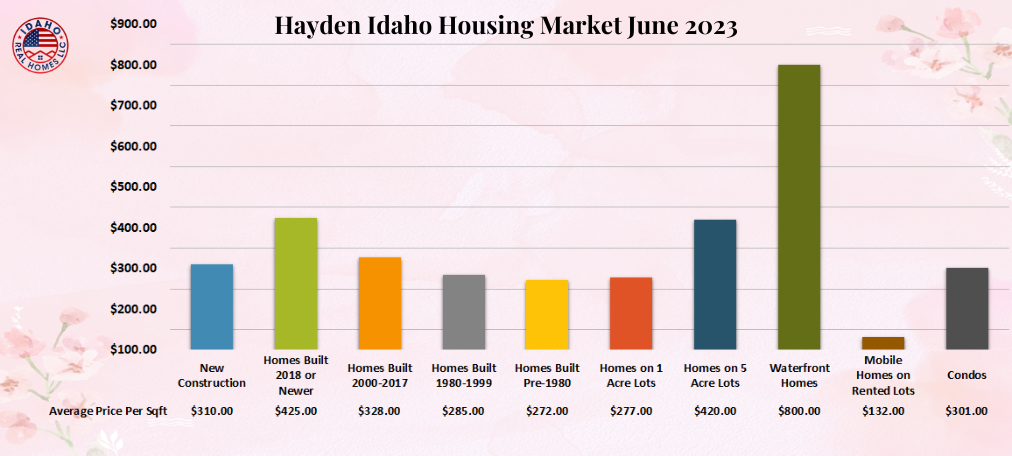
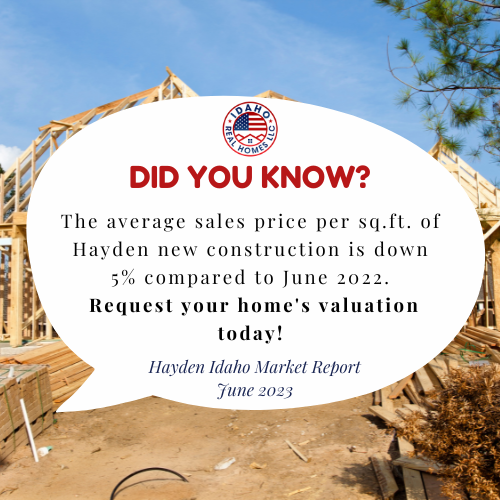
The volume of new construction home sales in Hayden is down one home and the average sales price per sq.ft. is down 5% over June 2022.
5 New construction homes were sold in Hayden, Idaho in June 2023 for an average of $310 per sq.ft. The average lot size was 0.2 acres.
These homes sold for an average of 99% of the original listed price. The high seller of the group sold for an average of $357 per sq.ft. and was from the Brantley Estates. The low seller of the group sold for an average of $263 per sq.ft. and was from the Carrington Meadows subdivision.
6 New construction homes sold in June 2022 for an average of $327 per SqFt.
3 New construction homes sold in June 2021 for an average of $278 per sqft. 14 New construction homes sold during June 2020 for an average of $176 per sqft. June 2019 had 11 new construction homes sell for an average of $223 per sqft. 8 Homes sold in June 2018 for an average price per sqft of $200.

The volume of home sales in the 2018+ age group is up by one home and the average sales price per square foot is up 13% over June 2022.
5 Existing homes that were built after 2018 were sold in Hayden, Idaho in June 2023 for an average of $425 per sq.ft. The average time on the market was 121 days. The average lot size was 0.3 acres.
These homes sold for an average of 93% of the original listed price. The high seller of the group sold for an average of $748 per sq.ft. The low seller of the group sold for an average of $316 per sq.ft. and was from the Dakota Grove subdivision.
Home sales in this group include homes from the Loch Haven Hills community.
June 2022 had 4 homes that were built after 2018 sell in Hayden for an average of $375 per sq.ft. & were on the market for an average of 47 days.
June 2021 had 6 homes sell for an average of $233 per sq.ft. & were on the market for an average of 65 days. June 2020 had 3 homes built after 2018 sell for an average of $219 per sq.ft. & were on the market for an average of 56 days. June 2019 had 2 homes that were built after 2018 sell for an average of $226 per sq.ft. & were on the market for an average of 68 days.
The volume of home sales in the 2000-2017 age group is up 14% and the average sales price per sq.ft. is down 0.6% over June 2022.
16 Homes that were built from 2000 to 2017 were sold in Hayden, Idaho in June 2023 for an average of $328 per sq.ft. The average time on the market was 60 days. The average lot size was 0.3 acres.
These homes sold for an average of 98% of the original listed price. The high seller of the group sold for an average of $484 per sq.ft. and was from the Rimrock Meadows subdivision. The low seller of the group sold for an average of $183 per sq.ft. and was from the Strawberry Fields subdivision.
Home sales in this group include homes from the Avondale; Broadmoore Estates; and Rosenberger communities.
14 Homes built from 2000-2017 sold in June 2022 for an average of $330 per sq.ft. & the average time on the market was 42 days.
18 Homes sold in June 2021 for an average of $328 per sq.ft. & were on the market for an average of 42 days. 26 Homes that were built after 2018 were sold in June 2020 for an average of $204 per sq.ft. The average time on the market was 54 days. 17 Homes sold in June 2019 for an average of $193 per sq.ft. & were on the market for an average of 50 days. 25 Homes sold in June 2018 for an average price per sq.ft. of $157 and were on the market for an average of 70 days.

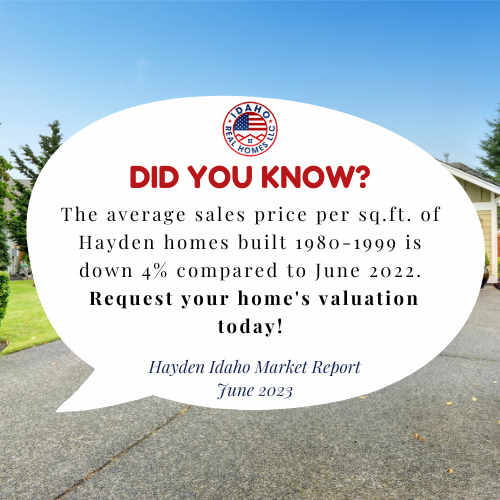
The volume of Hayden home sales, built 1980 to 1999, is down 80% and the average sales price per square foot is down 4% compared to June 2022.
2 Hayden homes built from 1980 to 1999 were sold in June 2023 for an average of $285 per sq.ft. The average time on the market was 48 days. The average lot size was 0.29 acres.
These homes sold for an average of 94% of the original listed price. The high seller of the group sold for an average of $324 per sq.ft. and was from the Avondale subdivision. The low seller of the group sold for an average of $246 per sq.ft. and was from the Leisure Park subdivision.
10 Homes that were built from 1980-1999 sold in June 2022 for an average of $298 per SqFt. The average time on the market was 46 days.
12 Homes sold in June 2021 for an average of $283 per sqft. The average time on the market was 49 days. 16 homes sold in June 2020 for an average of $208 per sqft. The average time on the market was 47 days. June 2019 had 11 homes sell for an average of $167 per sqft. and the average time on the market was 51 days. June 2018 had 12 homes averaging $156 per square foot and were on the market for an average of 68 days.
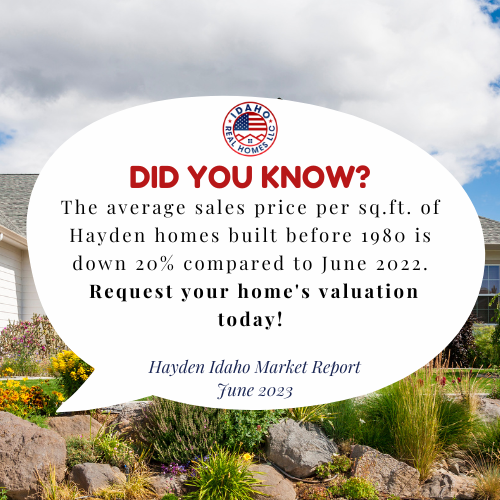
The volume of home sales in this age group is consistent with last year and the average sales price per sq.ft. is down 20% over June 2022.
6 Homes that were built before 1980 were sold in Hayden, Idaho in June 2023 for an average of $272 per sq.ft. The average time on the market was 89 days. The average lot size was 0.4 acres.
These homes sold for an average o0f 95% of the original listed price. The high seller of the group sold for an average of $358 per sq.ft. and was from the Avondale subdivision. The low seller of the group sold for an average of $177 per sq.ft and was also from the Avondale subdivision.
6 Homes that were built prior to 1980 sold in June 2022 for an average of $340 per SqFt. The average time on the market was 53 days.
10 Homes sold in June 2021 for an average of $274 per sqft. The average time on the market was 49 days. 5 Homes sold in June 2020 for an average of $204 per sqft. The average time on the market was 64 days. June 2019 had 3 homes sell for an average of $125 per sqft. and the average time on the market was 119 days. June 2018 had 5 homes sell for an average of $133 per sqft. and the average time on the market was 40 days.

The volume of Hayden home sales on 1 acre lots is up one home and the average sales price per square foot is down 38% over June 2022.
4 Homes on 1 acre lots were sold in Hayden, Idaho in June 2023 for an average of $277 per sq.ft. The average time on the market was 68 days. The average lot size was 1.07 acres.
These homes sold for an average of 93% of the original listed price. The high seller of the group sold for an average of $368 per sq.ft. and was from the Deer Park subdivision. The low seller of the group sold for an average of $206 per sq.ft. and was from the Avondale subdivision.
3 Homes sold in June 2022 for an average of $448 per SqFt. The average time on the market was 36 days. The average lot size was 0.98 acres.
1 Home sold in June 2021 for an average of $390 per sqft. The average time on the market was 47 days. 1 Home sold in June 2020 for an average of $229 per sqft. The average time on the market was 189 days. June 2019 had 4 homes sell for an average of $312 per sqft. and the average time on the market was 42 days. 3 Homes sold in June of 2018 for an average of $162 per square foot with average days on the market of 91 days.
Volume of home sales on 5 acres is consistent with last year and the average sales price per sq.ft. is up 1% compared to June 2022.
2 Homes on 5 acre lots were sold in Hayden, Idaho in June 2023 for an average of $420 per sq.ft. The average time on the market was 31 days. The average lot size was 4.2 acres.
These homes sold for an average of 99% of the original listed price. The high seller of the group sold for an average of $466 per sq.ft. The low seller of the group sold for an average of $373 per sq.ft.
2 Homes sold in June 2022 for an average of $414 per SqFt. The average time on the market was 76 days. The average lot size was 5 acres.
5 Homes sold during June 2021 for an average of $291 per sqft. The average time on the market was 76 days.
No June 2020 home sales in this group. 2 Homes on 5 acre lots sold for an average price per sqft of $213 with an average of 70 days on the market during June 2019. 3 Homes sold in June 2018 averaging $127 per square foot with an average of 118 days on market.

No Hayden homes on 10 acres were sold in June 2023.
2 Homes sold in the 10-acre group in June 2022 for an average of $305 per SqFt. The average time on the market was 146 days.
1 Home sold during June 2021 for an average of $274 per sqft. The average time on the market was 32 days. No June 2020 home sales in this group. 2 Homes on 10 acre lots sold for an average price per sqft of $196 with an average of 120 days on market during June 2019. June 2018 had 1 home sell for an average of $241 per square foot and was on the market for an average of 60 days.

The volume of waterfront home sales in Hayden is up by 5 homes and the average sales price per square foot is up 39% compared to June 2022.
6 Waterfront homes sold in Hayden, Idaho in June 2023 for an average of $800 per sq.ft. The average time on the market was 75 days. The average lot size was 0.56 acres.
These homes sold for an average of 98% of the original listed price. The high seller of the group sold for an average of $957 per sq.ft. and was from the Lakewood on Hayden subdivision. The low seller of the group sold for an average of $606 per sq.ft.and was from the North Shore Tracts.
1 Waterfront home sold in June 2022 for an average of $576 per SqFt. The average time on the market was 56 days. The average lot size was 0.43 acres.
2 Waterfront homes sold in June 2021 for an average of $644 per sqft. The average time on the market was 31 days. 5 Waterfront homes sold in June 2020 for an average of $332 per sqft. The average time on the market was 112 days. June 2019 had 3 waterfront homes sell for an average of $357 per sqft. and the average time on the market was 56 days. June 2018 had 4 homes sell for an average price per sqft of $482 with an average of 52 days on market.
The volume of manufactured home sales in Hayden is down 60% and the average sales price per sq.ft. is down 19% over June 2022.
2 Manufactured homes on leased lots were sold in Hayden, Idaho in June 2023 for an average of $132 per sq.ft. The average time on the market was 53 days.
These homes sold for an average of 96% of the original listed price. The high seller of the group sold for an average of $192 per sq.ft. and was from the Heatherstone subdivision. The low seller of the group sold for an average of $71 per sq.ft. and was from the Hayden Pines Park.
5 Manufactured homes on leased lots sold in June 2022 for an average of $162 per SqFt. The average time on the market was 29 days.
4 Manufactured homes on leased lots sold in June 2021 for an average of $102 per sqft. The average time on the market was 44 days. 1 Manufactured home sold in June 2020 for an average of $80 per sqft. The average time on the market was 74 days. June 2019 had 7 manufactured homes sell for an average of $96 per sqft. and the average time on the market was 57 days. June 2018 had 3 homes sell for an average price per sqft of $63 with an average of 73 days on market.

1 Condo sold in Hayden, Idaho in June 2023 for an average of $301 per sq.ft. The average time on the market was 88 days. The average lot size was 0.11 acres. This condo sold for an average of 85% of the original listed price and was from the Village Drive Condos.
1 Townhome sold in June 2022 for an average of $375 per SqFt. The average time on the market was 8 days. The average size of the lot was 0.1 acres.
1 Condo sold in June 2021 for an average of $302 per sqft. The average time on the market was 17 days. 1 Condo sold in June 2020 for an average of $182 per sqft. and the average time on the market was 27 days. June 2019 had 1 condo sell for an average of $187 per sqft. and the average time on the market was 57 days. June 2018 had 3 condos sell for an average price per sqft of $153 with an average of 65 days on market.