ste, 400
Coeur d' Alene, Id
83815
Call or text
Weekends by appointment Book your apt Here
ste, 400 Coeur d' Alene, Id 83815
Call or text
Weekends by appointment
Book your apt Here
Last updated on March 14th, 2023 at 07:23 pm
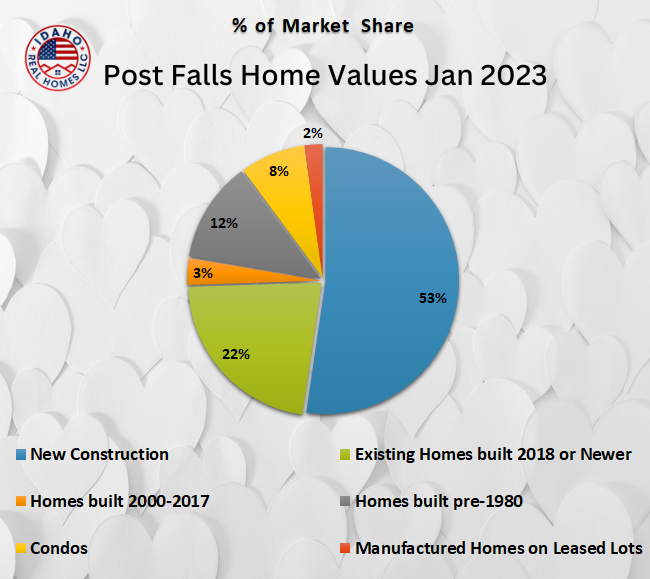
Post Falls home values for January 2023 are here! 46 Post Falls homes were sold in January 2023; homes on city lots sold for an overall average of $260 per sq.ft., they were on the market for an average of 125 days, and sold for an average of 94% of the original listed price. The average sales price for homes on city lots is down 8% over January 2022. Volume is down 35%.
Comparatively, 71 homes were sold in January 2022 for an overall average of $283 per sq.ft., were on the market for an average of 79 days, and sold for an average of 99% of the original listed price.
January 2021 had 70 home sales. January 2020 had 82 home sales. January 2019 had 72 home sales, and January 2018 had 70 home sales.
Are you searching for a home in Post Falls, Idaho or would you like more information about Post Falls? Visit our Post Falls real estate page here.
The volume of new construction home sales in Post Falls is up 9 homes and the average sales price per sq.ft. is down 0.7% over January 2022.
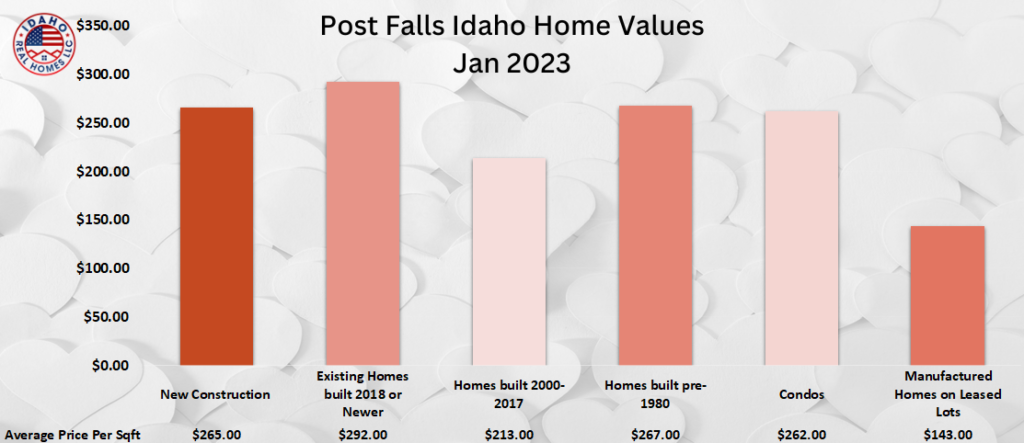
13 New construction homes were sold in Post Falls, Idaho in January 2023 for an average of $265 per sq.ft. The average lot size was 0.19 acres.
These homes sold for an average of 96% of the original listed price. The high seller of the group, built by Viking Construction, sold for an average of $318 per sq.ft. and was from the Montrose subdivision. The low seller of the group, built by Greenstone Homes, sold for an average of $193 per sq.ft. and was also from the Montrose subdivision.
Home sales in this group include homes from the Northplace community.
4 New construction homes sold in January 2022 for an average of $267 per sqft.
9 New construction homes sold in January 2021. The average sales price was $205 per sqft. 41 New construction homes sold in January 2020 for an average of $173 per sqft. 23 New construction homes sold in January 2019 for an average price per sqft of $143. January 2018 had 26 new construction homes sell for an average price of $123 per sqft.

The average sales price per sq.ft. in the 2018+ age group is down 13% over January 2022, sales volume is up by 4 homes.
5 Existing homes in the 2018+ age group were sold in Post Falls in January 2023 for an average of $292 per sq.ft. The average time on the market was 95 days. The average lot size was 0.19 acres.
These homes sold for an average of 93% of the original listed price. The high seller of the group sold for an average of $386 per sq.ft. and was from the Arrowleaf subdivision. The low seller of the group sold for an average of $241 per sq.ft. and was from the Foxtail subdivision.
Home sales in this group include homes from the Crown Pointe and the Compton communities.
January 2022 had 1 home sell in the 2018+ age group for an average of $336 per sq.ft. and the average time on the market was 11 days.
January 2021 had 6 homes in 2018+ age group that sold for an average of $249 per sq.ft. and were on the market for an average of 41 days. 2 Homes that were built after 2018 sold in January 2020 for an average of $214 per sq.ft. The average time on the market was 186 days.

The volume of home sales in the 2000-2017 age group is down by 7 homes and the average sales price per sq.ft. is down 24% compared to January 2022.
1 Home, built between 2000-2017, sold in Post Falls in January 2023 for an average of $213 per sq.ft. The average time on the market was 54 days. The average size of the lot was 0.51 acres.
This home sold for an average of 95% of the original listed price and was from the Prairie Meadows community.
January 2022 had 8 home sales in this group that sold for an average of $282 per sq.ft. and the average time on the market was 60 days.
January 2021 had 17 homes sell for an average of $225 per sq.ft. and were on the market for an average of 47 days. 17 Homes built from 2000-2017 sold in January 2020 for an average of $168 per sq.ft. The average time on the market was 58 days. 14 Homes built from 2000-2017 sold in January 2019 for an average of $164 per sq.ft. The average time on the market was 75 days. 14 Homes built 2000-2017 sold in January 2018 for an average of $142 per sq.ft. The average time on the market was 110 days.
No home sales in the 1980-1999 age group in Post Falls during January 2023.
11 Homes that were built from 1980-1999 sold in January 2022 for an average of $285 per sqft. The average time on the market was 66 days.
8 Homes sold in January 2021 for an average of $222 per sqft. The average time on the market was 57 days. 19 Homes sold in January 2020 for an average of $164 per sqft. The average time on the market was 60 days. January 2019 had 17 homes sell for an average of $162 per sqft. and the average time on the market was 87 days. 15 Homes sold in January 2018 for an average price per sqft of $136 with an average of 106 days on market.
The volume of Post Falls pre-1980 home sales is consistent with last year and the average sales price per sq.ft. is up 19% compared to January 2022.
3 Post Falls homes built pre-1980 sold in January 2023 for an average of $267 per sq.ft. The average time on the market was 137 days. The average lot size was 0.3 acres.
These homes sold for an average of 89% of the original listed price. The high seller of the group sold for an average of $299 per sq.ft. and was from the Compton subdivision. The low seller of the group sold for an average of $208 per sq.ft. and was from the Crestview subdivision.
3 Homes that were built prior to 1980 sold in January 2022 for an average of $225 per sqft. The average time on the market was 104 days.
5 Homes sold in January 2021 for an average of $221 per sqft. The average time on the market was 39 days. 7 Homes sold in January 2020 for an average of $139 per sqft. The average time on the market was 67 days. January 2019 had 8 homes sell for an average of $110 per sqft. and the average time on the market was 90 days.

No homes on 1-acre lots were sold in Post Falls in January 2023.
2 Homes sold in the 1-3 acre group in January 2022 for an average of $362 per sqft. The average time on the market was 97 days.
1 Home sold in the 1-3 acre group in January 2021 for an average of $312 per sqft. and the average time on the market was 60 days. No January 2020 home sales to compare to in this group. January 2019 had 1 home sell for an average of $179 per sqft. and the average time on the market was 127 days. No 2018 home sales to compare to.
No homes on 5-acre lots were sold in Post Falls in January 2023.
1 Home sold in January 2022 for an average of $331 per sqft. The average time on the market was 132 days.
1 Home sold in January 2021 for an average of $301 per sqft. and the average time on the market was 1 day. No January 2020 home sales to compare to in this group. January 2019 had one home sell for an average of $304 per sqft. and the average time on the market was 102 days. January 2018 had 3 homes selling for an average price per sqft of $150.
No homes on 10-acre lots were sold in Post Falls in January 2023.
2 Homes sold in January 2022 for an average of $334 per sqft. The average time on the market was 164 days. The average lot size was 9.7 acres.
No home sales in this group during January 2021. 2 Homes sold in January 2020 for an average of $232 per sqft. and the average time on the market was 97 days. January 2019 had one home sell for an average of $118 per sqft. and the average time on the market was 63 days. 2 Properties in January 2018 sold for an average price per sqft of $129 with an average of 123 days on the market.
No homes with over 10 acres were sold in Post Falls, Idaho in January 2023.
No January 2022 home sales in this group.
1 Home with over 10 acres sold during January 2021 for an average of $155 per sqft. and the average time on the market was 231 days. No January 2020 home sales to compare to in this group. No January 2019 or 2018 home sales to compare to.
No waterfront home sales in Post Falls during January 2023.
2 Waterfront homes sold in January 2022 for an average of $746 per sqft. The average time on the market was 152 days.
2 Waterfront homes sold in January 2021 for an average of $454 per sqft. and the average time on the market was 39 days. No January 2020 waterfront home sales to compare to. January 2019 had 2 homes sell for an average of $283 per sqft. and the average time on the market was 139 days. No 2018 sales to compare.
The volume of condo sales is consistent with last year and the average sales price per sq.ft. is down 15% over January 2022.
2 Condos were sold in Post Falls, Idaho in January 2023 for an average of $262 per sq.ft. The average time on the market was 84 days. The average lot size was 0.1 acres.
These condos were both from Forsythia Place and sold for an average of 92% of the original listed price. The high seller of the group sold for an average of $266 per sq.ft. The low seller of the group sold for an average of $258 per sq.ft.
2 Condos sold in January 2022 for an average of $310 per sqft. The average time on the market was 152 days.
2 Condos sold in January 2021 for an average of $259 per sqft. and the average time on the market was 31 days. No January 2020 condo sales to compare to in this group. January 2019 had 4 condos sell for an average of $214 per sqft. and the average time on the market was 115 days. January 2018 had 2 condos selling for an average price per sqft of $128.

The volume of mobile home sales on leased lots is consistent with last year and the average sales price per sq.ft. is up 13% over January 2022.
1 Manufactured home on a leased lot sold in January 2023 for an average of $143 per sq.ft. The average time on the market was 12 days. This home sold for an average of 100% of the original listed price and was from the Lucky Pines park.
1 Manufactured home on a leased lot sold in January 2022 for an average of $127 per sqft. The average time on the market was 82 days.
3 Manufactured homes on leased lots sold in January 2021 for an average of $79 per sqft. and the average time on the market was 37 days. 4 Manufactured homes on leased lots sold in January 2020 for an average of $49 per sqft. and the average time on the market was 40 days. 2 Manufactured homes on leased lots sold for an average price per sqft of $61 with average days on the market of 74 days during January 2019. January 2018 had 1 manufactured home sell for an average of $22 per sqft.
Would you like a detailed report about the value of your home?
Send in a Home Valuation Request today! If you would like more information about Post Falls, Idaho visit our Post Falls real estate page here.