350 E Kathleen Ave
ste, 400
Coeur d' Alene, Id
83815
1-208-719-9010
Call or text
Mon - Fri: 9:00 - 5pm
Weekends by appointment Book your apt Here

ste, 400
Coeur d' Alene, Id
83815
Call or text
Weekends by appointment Book your apt Here

ste, 400 Coeur d' Alene, Id 83815
Call or text
Weekends by appointment
Book your apt Here
Last updated on February 16th, 2023 at 09:43 am
Here is the latest Post Falls market data. 86 Homes were sold in Post Falls, Idaho in the month of October 2022. The market is shifting quite a bit, with 54 fewer homes sold this year compared to October 2021’s 140 home sales. The volume is down 38% over October 2021. Overall, Post Falls single-family homes on less than an acre sold for an average of $279 per SqFt & were on the market for an average of 84 days. The average sales price is up by 5% and the average days on the market are up by 24% over October 2021.
In previous years: October 2020 had 166 home sales, October 2019 had 126 home sales, October 2018 had 122 home sales, and October 2017 had 121 home sales.
Our monthly real estate market reports have the average price per square foot of new construction homes, homes on city lots, homes on acreage, condos, waterfront, and much more. We also have the average days on the market for each group of homes and much of the original listed price they sold for.
Are you curious about previous market reports or want more information about Post Falls? Visit our main page for Post Falls, Idaho!
Continue reading to learn more about the Post Falls housing market in October 2022.
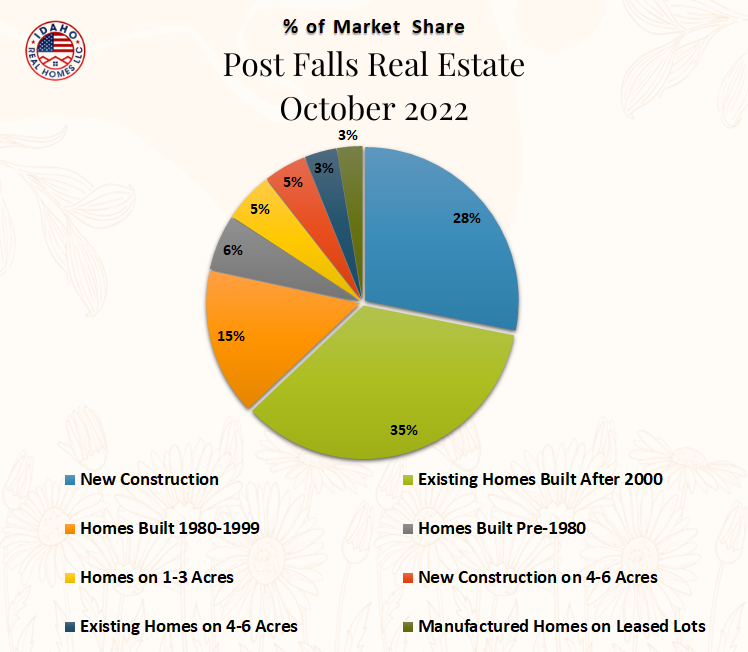
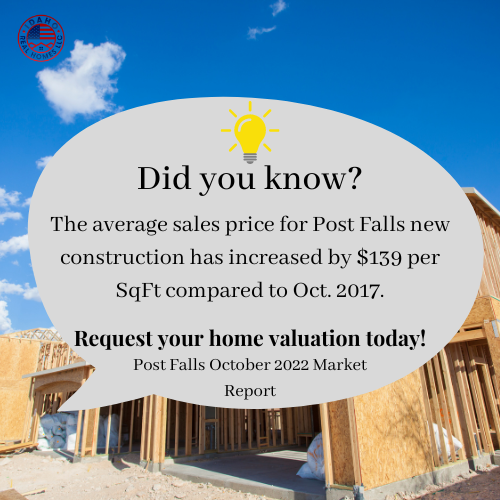
The volume of new construction home sales has increased by 2 homes and the average sales price per SqFt has increased by 5% compared to October 2021.
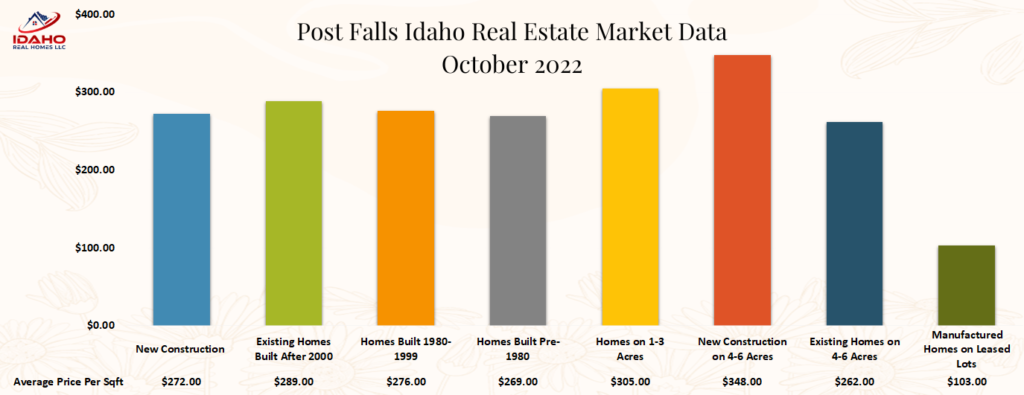
In October 2022, 24 New construction homes were sold in Post Falls for an average of $272 per SqFt. The average lot size was 0.2 acres.
These homes sold for an average of 98% of the original listed price. The high seller of the group sold for an average of $355 per SqFt and was from the Pradera subdivision. The low seller of the group sold for an average of $201 per SqFt and was from the North Place subdivision.
Home sales in this group include homes from the Montrose and Prairie Falls communities.
The following are Post Falls new construction home sales in previous years.
22 New construction homes sold in October 2021 for an average of $259 per sqft. The average lot size was 0.17 acres.
40 New construction homes sold in October 2020 for an average of $189 per sqft. 46 New construction homes sold in October 2019 for an average of $181 per sqft. 34 New Construction homes sold in October 2018 for an average price per sqft. of $145. 25 New construction homes sold in October 2017 for an average price per sqft. of $133.

The volume of home sales for homes built after 2000 has decreased by 39% and the average sales price per SqFt has increased by 4% compared to October 2021.
In October 2022, 28 Existing homes that were built after 2000 were sold for an average of $289 per SqFt. The average time on the market was 67 days. The average lot size was 0.19 acres.
These homes sold for an average of 94% of the original listed price. The high seller of the group sold for an average of $398 per SqFt and was from the Meadow Grove subdivision. The low seller of the group sold for an average of $155 per SqFt and was from the Montrose subdivision.
Home sales in this group include homes from the North Place; Crown Pointe; Crossings; Fieldstone; Greenside Vista; Prairie Falls; Highland Park; and Riverside Harbor communities.
Previous Post Falls housing market data.
46 Existing homes that were built after 2000 sold in October 2021 for an average of $277 per sqft. The average time on the market was 65 days. The average lot size was 0.19 acres.
66 Homes were sold in October 2020 for an average of $215 per sqft. The average time on the market was 56 days. 38 Homes were sold in October 2019 for an average of $182 per sqft. and the average time on the market was 65 days. 25 Homes sold in October 2018 for an average of $159 per sqft. and spent an average of 56 days on the market.
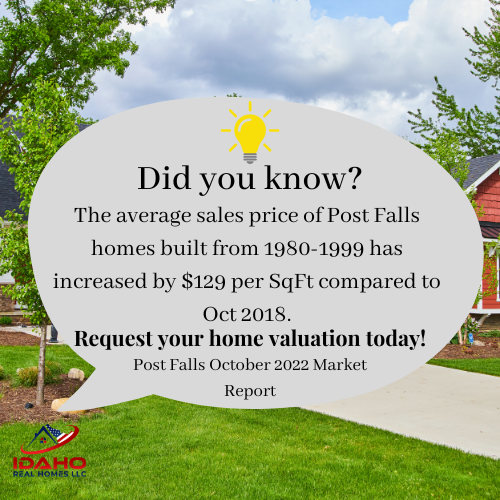
The volume of home sales for homes built from 1980-1999 has decreased by 64% and the average sales price per SqFt has increased by 3% compared to October 2021.
13 Homes that were built from 1980 to 1999 were sold in Post Falls in the month of October 2022 for an average of $276 per SqFt. The average time on the market was 50 days. The average lot size was 0.24 acres.
These homes sold for an average of 93% of the original listed price. The high seller of the group sold for an average of $358 per SqFt and was from the Timbercrest subdivision. The low seller of the group sold for an average of $154 per SqFt and was from the Royal Highlands subdivision.
Home sales in this group include homes from the Riverside Harbor; Harmony Place; and Pioneer Ridge communities.
Homes sold that were built from 1980-1999 in previous years.
36 Homes that were built 1980-1999 sold in October 2021 for an average of $267 per sqft. The average time on the market was 51 days. The average lot size was 0.2 acres.
23 Homes that were built from 1980-1999 sold in October 2020 for an average of $194 per sqft. The average time on the market was 43 days. 19 Homes that were built between 1980-1999 sold in October 2019 for an average of $156 per sqft. The average time on the market was 63 days. 18 homes sold during October 2018 for an average price per sqft of $147 and were on the market for an average of 48 days.
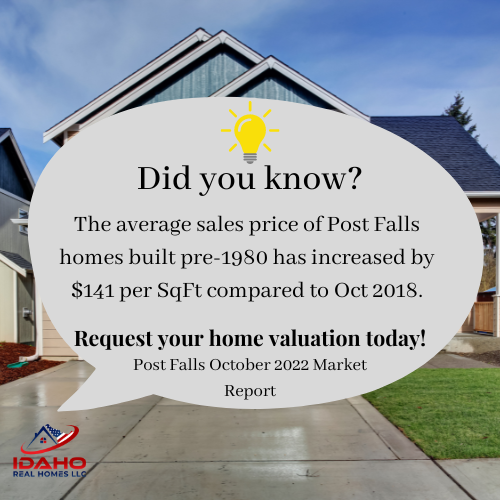
The volume of home sales, for homes built pre-1980, has decreased by 67% and the average sales price per SqFt has increased by 15% compared to October 2021.
5 Homes that were built prior to 1980 were sold in Post Falls in October 2022 for an average of $269 per SqFt. The average time on the market was 51 days. The average lot size was 0.4 acres.
These homes sold for an average of 93% of the original listed price. The high seller of the group sold for an average of $410 per SqFt. The low seller of the group sold for an average of $191 per SqFt and was from the Pinevilla subdivision.
The following are the Post Falls home values in previous years.
15 Homes that were built pre-1980 sold in October 2021 for an average of $234 per sqft. The average time on the market was 53 days. The average lot size was 0.27 acres.
17 Homes that were built prior to 1980 sold in October 2020 for an average of $175 per sqft. The average time on the market was 49 days. 10 Homes that were built prior to 1980 sold in October 2019 for an average of $118 per sqft. The average time on the market was 69 days. 12 Homes sold in October 2018 for an average price per sqft of $128 with an average of 61 days on market.
The volume of home sales on 1-3 acres has increased by 3 homes and the average sales price per SqFt has increased by 16% compared to October 2021.
4 Post Falls homes on 1-3 acres were sold in October 2022 for an average of $305 per SqFt. The average time on the market was 65 days. The average lot size was 2 acres.
These homes sold for an average of 86% of the original listed price. The high seller of the group sold for an average of $399 per SqFt and was from The Meadows subdivision. The low seller of the group sold for an average of $264 per SqFt and was from the Post Falls Irrigation subdivision.
Home sales on 1-3 acres in previous years.
1 Home sold in the 1-3 acre group in October 2021 for an average of $262 per sqft. The average time on the market was 63 days. The average lot size was 1 acre.
6 Homes sold in October 2020 for an average of $262 per sqft. The average time on the market was 35 days. No home sales in this category for the month of October 2019. 4 Homes sold in October of 2018 for an average of $150 per sqft. and spent an average of 80 days on the market. October 2017 had 2 homes sell for an average price per sqft. of $124 with an average of 161 days on the market.

3 New construction homes on acreage sold in Post Falls in October 2022 for an average of $348 per SqFt. The average lot size was 5 acres.
These homes sold for an average of 107% of the original listed price. The high seller of the group sold for an average of $419 per SqFt. The low seller of the group sold for an average of $295 per SqFt.
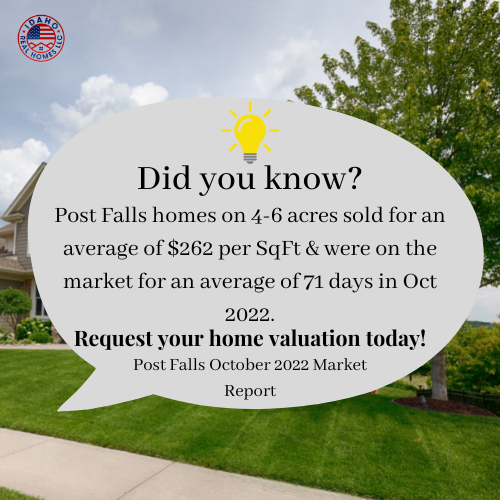
The volume of existing home sales on 4-6 acres has decreased by 3 homes and the average sales price has decreased by 27% compared to October 2021.
3 Existing homes on 4-6 acres were sold in October 2022 for an average of $262 per SqFt. The average time on the market was 71 days. The average lot size was 4.7 acres.
These homes sold for an average of 90% of the original listed price. The high seller of the group sold for an average of $323 per SqFt and was from the Brickert subdivision. The low seller of the group sold for an average of $230 per SqFt.
Previous Post Falls home sales on 4 to 6 acres.
6 Homes sold in October 2021 for an average of $359 per sqft. The average time on the market was 47 days. The average lot size was 4.8 acres.
1 Home sold in October 2020 for an average of $338 per sqft. The average time on the market was 39 days. 2 Homes sold in October of 2019 for an average of $253 per sqft. and spent an average of 56 days on the market. 4 Homes sold in October 2018 for an average of $200 per sqft. and spent an average of 85 days on the market. October 2017 had 3 homes sell for an average price per sqft of $198 and were on the market for an average of 89 days.
No homes on 6-10 acres were sold in Post Falls in October 2022.
No October 2021 home sales in this group.
1 Home sold in October 2020 for an average of $147 per sqft. and the average time on the market was 119 days. 1 Home sold in October 2019 for an average of $130 per sqft. and spent an average of 42 days on the market. No October 2018 sales on homes on 10-acre lots. October 2017 2 homes sell for an average price per sqft of $162 with an average of 80 days on the market.
No homes with over 10 acres were sold in October 2022.
No October 2021 home sales in this group.
No October 2020 home sales in this group. 1 Existing home in the >10-acre category sold in October 2019 for an average of $232 per sqft. and spent an average of 64 days on the market. No October 2018 home sales to compare to.
No waterfront homes were sold in Post Falls in October 2022.
3 Waterfront homes sold in October 2021 for an average of $618 per sqft. The average time on the market was 53 days. The average lot size was 0.3 acres.
4 Waterfront homes sold in October 2020 for an average of $328 per sqft. The average time on the market was 73 days. 2 Waterfront homes sold in October of 2019 for an average of $225 per sqft. and spent an average of 62 days on the market. October 2018 had 7 homes sell for an average of $320 per sqft. and spent an average of 131 days on the market. No 2017 home sales to compare to.
No Post Falls condos were sold in October 2022.
3 Condos sold in October 2021 for an average of $265 per sqft. The average time on the market was 75 days. The average lot size was 0.07 acres.
7 Condos sold in October 2020 for an average of $250 per sqft. The average time on the market was 45 days. 5 Condos sold in October 2019 for an average of $166 per sqft. and spent an average of 76 days on the market. 3 Condos sold in October 2018 for an average price per sqft of $148 with spent an average of 50 days on the market. October 2017 had 5 condo sales that sold for an average of $162 per sqft. and spent an average of 71 days on the market.
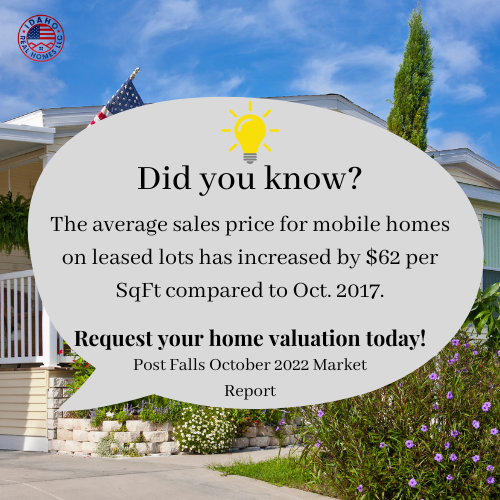
The volume of manufactured home sales has decreased by one home and the average sales price has increased by 7% compared to October 2021.
6 Manufactured homes on rented lots were sold in Post Falls in October 2022 for an average of $103 per SqFt. The average time on the market was 73 days.
These mobile homes sold for an average of 86% of the original listed price. The high seller of the group sold for an average of $185 per SqFt and was from the Camelot Estates. The low seller of the group sold for an average of $35 per SqFt and was from the Arundel Park.
7 Manufactured homes on leased lots sold in October 2021 for an average of $96 per sqft. The average time on the market was 45 days.
1 Manufactured home on a leased lot sold in October 2020 for an average of $35 per sqft. The average time on the market was 76 days. 2 Manufactured homes on leased lots sold in October of 2019 for an average of $49 per sqft. and spent an average of 43 days on the market. 6 Manufactured homes sold in October 2018 for an average price per sqft of $106. They were on the market for an average of 59 days. October 2017 9 homes on rented lots sell for an average price per sqft of $41 with an average of 52 days on the market.
