
350 E Kathleen Ave
ste, 400
Coeur d' Alene, Id
83815
1-208-719-9010
Call or text
Mon - Fri: 9:00 - 5pm
Weekends by appointment Book your apt Here

ste, 400
Coeur d' Alene, Id
83815
Call or text
Weekends by appointment Book your apt Here

ste, 400 Coeur d' Alene, Id 83815
Call or text
Weekends by appointment
Book your apt Here
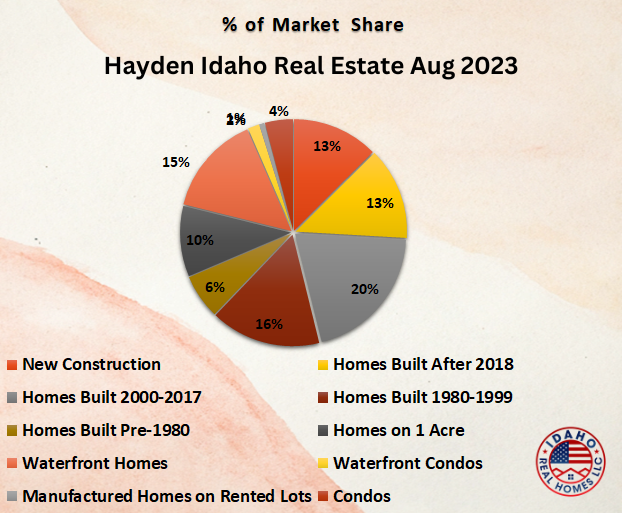
43 Homes were sold in Hayden, Idaho in August 2023. Hayden homes on city lots sold for an overall average of $323 per sq.ft., they were on the market for an average of 82 days, and sold for an average of 95% of the original listed price. The average sales price per square foot is up 3% over August 2022. Volume is down 6.5%.
46 Homes were sold in August 2022 for an average of $313 per square foot, were on the market for an average of 62 days and sold for an average of 98% of the original listed price.
August 2021 had 65 home sales, August 2020 had 74 home sales, August 2019 had 64 home sales, and August 2018 had 70 home sales.
Read more to learn about the average home values and more for new construction, existing homes, homes on acreage, waterfront, and more in Hayden, Idaho.
Are you searching for a Hayden home or would you like more information about Hayden, Idaho? Visit our Hayden Real Estate page here!
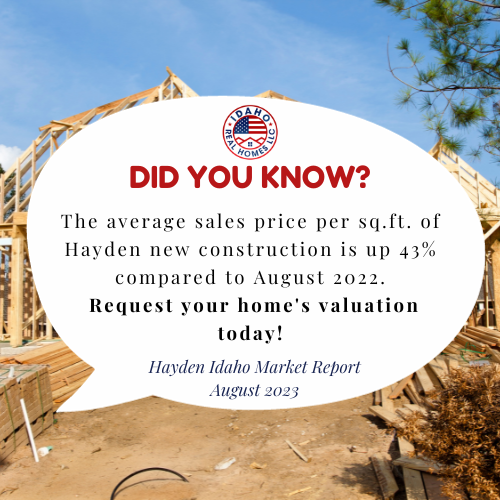
The volume of new construction home sales is up one home and the average sales price per sq.ft. is up 43% over August 2022.
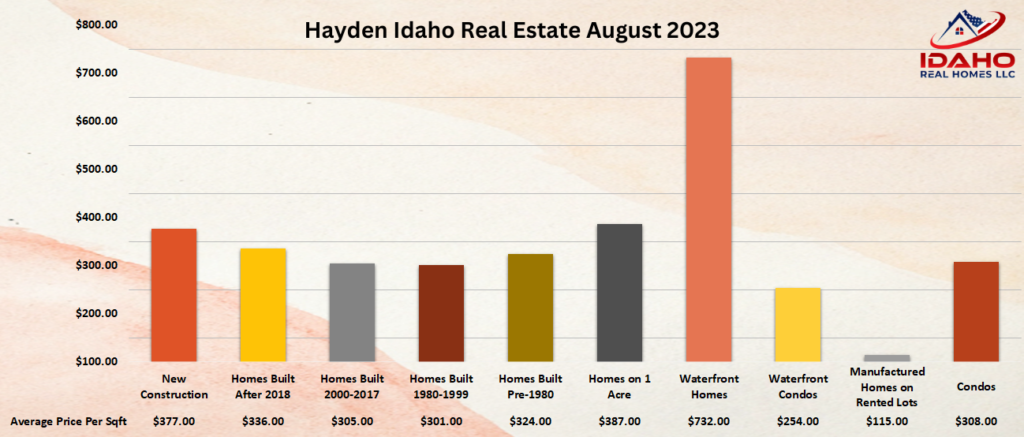
5 New construction homes sold in Hayden, Idaho in August 2023 for an average of $377 per sq.ft. The average lot size was 0.24 acres.
These homes sold for an average of 99% of the original listed price. The high seller of the group sold for an average of $401 per sq.ft. and was from the Stone Creek subdivision. The low seller of the group soldfor an average of $339 per sq.ft. and was from the Brantley Estates.
4 New construction homes were sold in Hayden in August 2022 for an average of $264 per SqFt.
9 New construction homes sold in August 2021 for an average of $283 per sqft. 14 New construction homes sold in August 2020 for an average of $178 per sqft. 10 New Construction homes sold in August 2019 for an average of $196 per sqft. August 2018 had 14 new construction homes sell for an average of $291 per sqft.
The volume of Hayden home sales in the 2018+ age group is up two homes and the average sales price per sq.ft. is down 18% over August 2022.
6 Existing homes that were built after 2018 were sold in Hayden, Idaho in August 2023. The average sales price was $336 per sq.ft. The average time on the market was 58 days. The average lot size was 0.28 acres.
These homes sold for an average of 93% of the original listed price. The high seller of the group sold for an average of $378 per sq.ft. and was from the Forest Ridge subdivision. The low seller of the group sold for an average of $240 per sq.ft. and was from the Maple Grove subdivision.
August 2022 had 4 homes, built after 2018, sell for an average of $410 per sq.ft. and were on the market for an average of 64 days.
August 2021 had 6 homes sell for an average of $377 per sq.ft. & the average time on the market was 32 days. 2 Homes sold in August 2020 for an average of $177 per sq.ft. and were on the market for an average of 27 days.


The volume of home sales in the 2000-2017 age group is down 23% and the average sales price per sq.ft. is up 2% over August 2022.
10 Homes built from 2000-2017 were sold in Hayden, Idaho in August 2023 for an average of $305 per sq.ft. The average time on the market was 63 days. The average lot size was 0.28 acres.
These homes sold for an average of 94% of the original listed price. The high seller of the group sold for an average of $407 per sq.ft. and was from the Broadmoore Estates. The low seller of the group sold for an average of $231 per sq.ft. and was from the Strawberry Fields subdivision.
Home sales in this group include homes from the Leisure Park community.
13 Homes sold in August 2022 for an average of $299 per sq.ft. and the average time on the market was 59 days.
17 Homes sold in August 2021 for an average of $327 per sq.ft. and the average time on the market was 50 days. 19 Homes sold in August 2020 for an average of $190 per sq.ft. and the average time on the market was 53 days. 22 Homes sold in August 2019 for an average of $182 per sqft and spent an average of 54 days on the market. August 2018 12 homes sold for an average of $166 per sqft. and the average time on the market was 59 days.
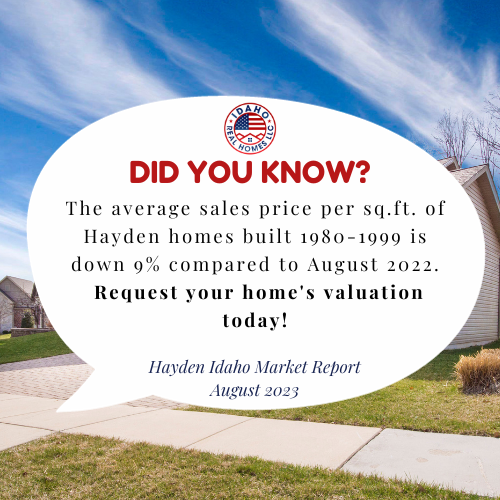
The volume of home sales in the 1980 to 1999 age group is up 33% and the average sales price per sq.ft. is down 9% over August 2022.
8 Homes that were built from 1980-1999 sold in Hayden in August 2023 for an average of $301 per sq.ft. The average time on the market was 78 days. The average lot size was 0.24 acres.
These homes sold for an average of 97% of the original listed price. The high seller of the group sold for an average of $377 per sq.ft. and was from the Stinson subdivision. The low seller of the group sold for an average of $187 per sq.ft. and was from the Hayden Lake Irrigation.
Home sales in this group include homes from the Davis Center, Leisure Park, and Woodland Meadows communities.
6 Homes that were built from 1980-1999 were sold in August 2022 for an average of $330 per SqFt and the average time on the market was 43 days.
11 Homes sold in August 2021 for an average of $286 per sqft. The average time on the market was 47 days. 9 Homes sold in August 2020 for an average of $188 per sqft. The average time on the market was 63 days. 10 Homes sold in August 2019 for an average of $177 per sqft and spent an average of 71 days on the market. August 2018 had 13 homes sell for an average of $160 per sqft. and the average time on the market was 62 days.

The volume of home sales in the pre-1980 age group is down two homes and the average sales price per sq.ft. is up 12% over August 2022.
3 Homes that were built before 1980 sold in Hayden, Idaho in August 2023 for an average of $324 per sq.ft. The average time on the market was 55 days. The average lot size was 0.4 acres.
These homes sold for an average of 94% of the original listed price. The high seller of the group sold for an average of $385 per sq.ft. and was from the Hayden Lake subdivision. The low seller of the group sold for an average of $241 per sq.ft. and was from the Emerald Estates.
5 Homes that were built pre-1980 sold in Hayden in August 2022 for an average of $290 per SqFt. The average time on the market was 53 days.
9 Homes sold in August 2021 for an average of $263 per sqft. The average time on the market was 68 days. 9 Homes sold in August 2020 for an average of $217 per sqft. The average time on the market was 53 days. 9 Homes were sold in August 2019 for an average of $140 per sqft. and these homes spent an average of 82 days on the market. August 2018 had 6 homes sell for an average of $137 per sqft. and the average time on the market was 59 days.
The volume of home sales on 1 acre is up two homes and the average sales price per sq.ft.is up 12% over August 2022.
4 Homes on 1-acre lots were sold in Hayden, Idaho in August 2023 for an average of $387 per sq.ft. The average time on the market was 77 days. The average lot size was 1.6 acres.
These homes sold for an average of 93% of the original listed price. The high seller of the group sold for an average of $588 per sq.ft. The low seller of the group sold for an average of $253 per sq.ft. and was from the Hayden Lake Irrigation subdivision.
Home sales in this group include homes from the Avondale community.
2 Homes on 1-acre lots sold in August 2022 for an average of $346 per SqFt. The average time on the market was 54 days.
2 Homes sold in August 2021 for an average of $286 per sqft. The average time on the market was 25 days. 2 Homes sold in August 2020 for an average of $214 per sqft. The average time on the market was 26 days. No home sales with 1-acre in August 2019. 2 Homes on 1-acre lots sold in August 2018 for an average of $177 per square foot and were on the market for an average of 72 days.

No Hayden home sales on 5 acres in August 2023.
No Hayden homes on 5 acres were sold in August 2022.
3 Homes sold in August 2021 for an average of $264 per sqft. The average time on the market was 56 days. 3 Homes sold in August 2020 for an average of $247 per sqft. The average time on the market was 65 days. 4 Homes were sold in August 2019 for an average of $185 per sqft and spent an average of 87 days on the market. 5 Homes sold in August 2018 for an average price per square foot of $214 and were on the market an average of 154 days.
No Hayden home sales on 10 acres in August 2023.
3 Homes sold in August 2022 for an average of $440 per SqFt. The average time on the market was 100 days.
1 Home sold in August 2021 for an average of $379 per sqft. The average time on the market was 78 days. 2 Homes sold in August 2020 for an average of $330 per sqft. The average time on the market was 130 days. One home sold in August 2019 for an average of $823 per sqft and spent an average of 92 days on the market. August 2018 had 2 homes sell for an average of $171 per sqft. and the average time on the market was 210 days.

The volume of waterfront home sales in Hayden is down one home and the average sales price per sq.ft. is down 8% over August 2022.
3 Waterfront homes were sold in Hayden, Idaho in August 2023 for an average of $732 per sq.ft. The average time on the market was 59 days. The average lot size was 0.5 acres.
These homes sold for an average of 99% of the original listed price. The high seller of the group sold for an average of $1,042 per sq.ft. and was from the McCauley subdivision. The low seller of the group sold for an average of $548 per sq.ft. and was from the Point Hayden subdivision.
Home sales in this group include a home from the Avondale community.
4 Waterfront homes sold in August 2022 for an average of $796 per SqFt. The average time on the market was 53 days.
2 Waterfront homes sold in August 2021 for an average of $945 per sqft. The average time on the market was 74 days. 6 Waterfront homes sold in August 2020 for an average of $414 per sqft. The average time on the market was 98 days. 4 Waterfront homes were sold in August 2019 for an average of $323 per sqft. They spent an average of 249 days on the market. August 2018 had 5 waterfront homes sell for an average of $350 per sqft. and the average time on the market was 86 days.
1 Waterfront condo sold in Hayden, Idaho in August 2023 for an average of $254 per sq.ft. The average time on the market was 57 days. The average lot size was 0.22 acres. This home sold for an average of 92% of the original listed price and was from the Ntaken Village subdivision.
The volume of mobile home sales in Hayden is down three homes and the average sales price per sq.ft. is down 21% over August 2022.
1 Manufactured home on a leased lot sold in Hayden, Idaho in August 2023 for an average of $115 per sq.ft. The average time on the market was 62 days. This home sold for an average of 97% of the original listed price and was from the Hayden Pines 55+ community.
4 Manufactured homes on leased lots sold in August 2022 for an average of $145 per SqFt. The average time on the market was 32 days.
1 Manufactured home sold in August 2021 for an average of $130 per sqft. The average time on the market was 56 days. 3 Manufactured homes sold in August 2020 for an average of $73 per sqft. The average time on the market was 30 days. 3 Manufactured homes sold in August 2019 for an average of $86 per sqft and spent an average of 39 days on the market. August 2018 had 2 homes sell for an average price per square foot of $100. The average days on the market were 37 days.
The volume of Hayden condo sales is up one home and the average sales price per sq.ft. is down 4% over August 2022.
2 Condos were sold in Hayden, Idaho in August 2023 for an average of $308 per sq.ft. The average time on the market was 60 days. The average lot size was 0.1 acre.
These condos sold for an average of 100% of the original listed price. The high seller of the group sold for an average of $319 per sq.ft. and was from the Honeysuckle Glen condos. The low seller of the group sold for an average of $297 per sq.f.t and was from the Coopers Bay condos.
1 Condo sold in August 2022 for an average of $322 per SqFt. The average time on the market was 41 days.
No Condo sales during August 2021. 1 Townhome sold in August 2020 for an average of $277 per sqft. The average time on the market was 13 days. August 2019 had 1 condo sell for an average of $168 per sqft and spent an average of 45 days on the market. August 2018 had 3 condos sell for an average of $163 per square foot and were on the market an average of 45 days.
Request a free home valuation here to get started!