
350 E Kathleen Ave
ste, 400
Coeur d' Alene, Id
83815
1-208-719-9010
Call or text
Mon - Fri: 9:00 - 5pm
Weekends by appointment Book your apt Here

ste, 400
Coeur d' Alene, Id
83815
Call or text
Weekends by appointment Book your apt Here

ste, 400 Coeur d' Alene, Id 83815
Call or text
Weekends by appointment
Book your apt Here
Last updated on April 17th, 2023 at 10:36 am
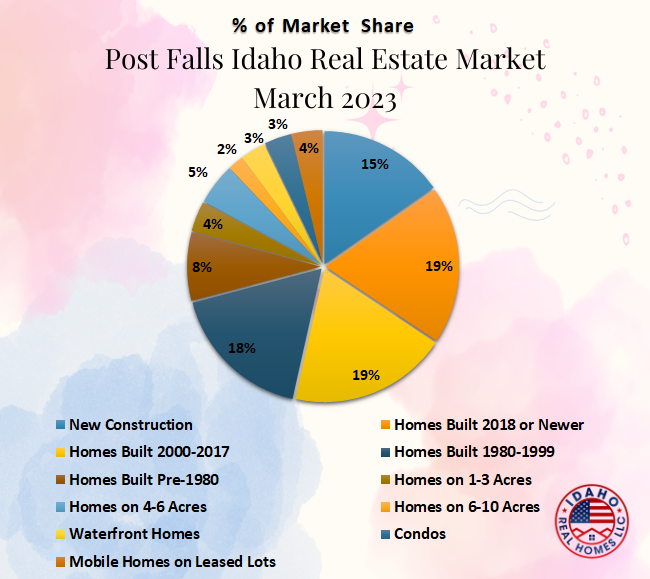
91 Homes were sold in Post Falls, Idaho in the month of March 2023. Post Falls homes on less than an acre sold for an overall average of $267 per square foot, they were on the market for an average of 86 days, and sold for an average of 98% of the original listed price. The average sales price per sq.ft. is down 9% compared to March 2022. Volume is down 8%.
99 Homes were sold in Post Falls, Idaho in March 2022: homes on city lots sold for an overall average of $296 per sq.ft., were on the market for an average of 69 days, and sold for an average of 101% of the original listed price. March 2021 had 106 home sales. March 2020 had 117 home sales, March 2019 had 82 home sales, and March 2018 had 104 home sales.
Read more below to see how the average price ranges by age group, lot size, and more! If you would like more information about Post Falls, Idaho, visit our Post Falls Real Estate page here!
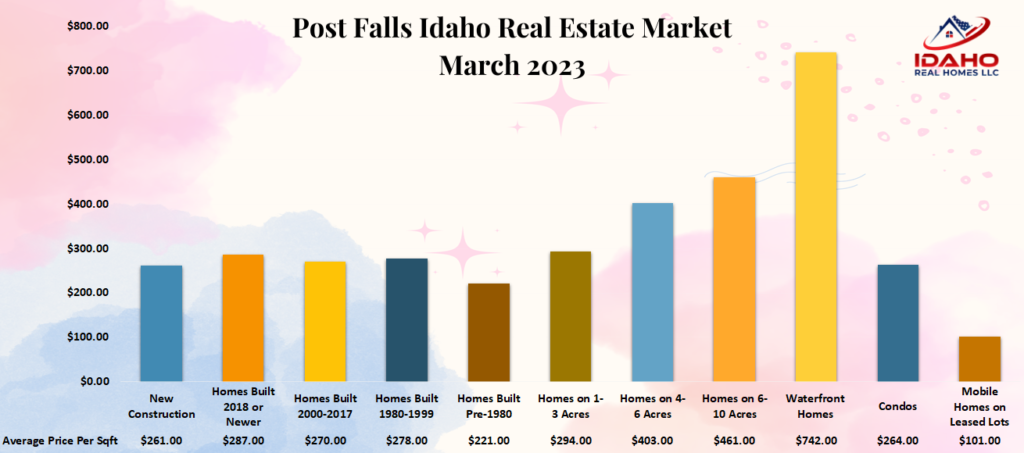
The volume of new construction home sales in Post Falls is down 12% and the average sales price per sq.ft. is down 14% over March 2022.
14 New construction homes were sold in Post Falls, Idaho in March 2023 for an average of $261 per sq.ft. The average lot size was 0.18 acres.
These homes sold for an average of 97% of the original listed price. The high seller of the group, built by Architerra Homes, sold for an average of $393 per sq.ft. and was from The Parkllyn Estates. The low seller of the group, built by Viking Construction, sold for an average of $182 per sq.ft. and was from the Montrose subdivision.
Home sales in this group include homes from the Northplace subdivision.
16 New construction homes sold in March 2022 for an average of $305 per SqFt.
March 2021 had 23 new construction homes sell for an average of $207 per SqFt. 22 New construction homes sold in March 2020 for an average of $178 per sqft. March 2019 had 24 new construction homes sell for an average of $150 per sqft. 31 New construction homes sold in March of 2018 for an average price per sqft of $135.

The volume of home sales in the +2018 age group is down 15% and the average sales price per sq.ft. is down 7% compared to March 2022.
16 Existing homes that were built after 2018 were sold in Post Falls in March 2023 for an average of $287 per sq.ft. The average time on the market was 42 days. The average lot size was 0.2 acres.
These homes sold for an average of 100% of the original listed price. The high seller of the group sold for an average of $413 per sq.ft. and was from the Ashton Villas subdivision. The low seller of the group sold for an average of $225 per sq.ft. and was from the Montrose subdivision.
Home sales in this group includes homes from the Crown Pointe; North Place; and Woodbridge South communities.
19 Homes that were built after 2018 were sold in March 2022 for an average of $311 per sq.ft. and were on the market for an average of 43 days.
March 2021 had 15 homes sell for an average of $267 per sq.ft. and were on the market for an average of 30 days. March 2020 had 11 homes sell in this age group for an average of $196 per sq.ft. and were on the market for an average of 53 days.

The volume of home sales in the 2000-2017 age group is down 22% and the average sales price per sq.ft. is down 11% over March 2022.
17 Post Falls homes that were built from 2000-2017 were sold in March 2023 for an average of $270 per sq.ft. The average time on the market was 87 days. The average lot size was 0.16 acres.
These homes sold for an average of 96% of the original listed price. The high seller of the group sold for an average of $348 per sq.ft. and was from the Woodbridge South subdivision. The low seller of the group sold for an average of $180 per sq.ft. and was from the Fieldstone subdivision.
Home sales in this group include homes from the Tullamore; Prairie Falls; and Woodbridge South communities.
22 Homes that were built from 2000-2017 sold in March 2022 for an average of $305 per sq.ft. & were on the market for an average of 56 days.
March 2021 had 28 homes sell for an average of $267 per sq.ft. & were on the market for an average of 35 days. March 2020 had 26 homes sell for an average of $278 per sq.ft. & were on the market for an average of 54 days. March 2019 had 30 homes sell for an average of $160 per sqft. and the average time on the market was 64 days. March of 2018 had 30 homes sell for an average price per sqft of $149 with an average of 75 days on the market.

The volume of Post Falls home sales in the 1980-1999 age group is up 25% and the average sales price per sq.ft. is down 4% over March 2022.
15 Homes in Post Falls that were built from 1980 to 1999 were sold in March 2023 for an average of $278 per sq.ft. The average time on the market was 48 days. The average lot size was 0.18 acres.
These homes sold for an average of 98% of the original listed price. The high seller of the group sold for an average of $410 per sq.ft. and was from the Riverside Harbor subdivision. The low seller of the group sold for an average of $225 per sq.ft. and was also from the Riverside Harbor subdivision.
Home sales in this group include homes from the Montrose; and Prairie Falls communities.
12 Homes that were built from 1980-1999 sold in March 2022 for an average of $290 per SqFt. The average time on the market was 48 days.
March 2021 had 14 homes sell for an average of $250 per SqFt. & the average time on the market was 45 days. 19 Homes sold in March 2020 for an average of $176 per sqft. & the average time on the market was 66 days. March 2019 had 13 homes sell for an average of $141 per sqft. & the average time on the market was 62 days.

The volume of home sales for homes built pre 1980 is up 28% and the average sales price per sq.ft. is up 9% over March 2022.
9 Homes in Post Falls that were built before 1980 were sold in March 2023 for an average of $221 per sq.ft. The average time on the market was 59 days. The average lot size was 0.25 acres.
These homes sold for an average of 98% of the original listed price. The high seller of the group sold for an average of $357 per sq.ft. The low seller of the group sold for an average of $170 per sq.ft.
7 Homes that were built before 1980 sold in March 2022 for an average of $202 per SqFt. The average time on the market was 32 days.
March 2021 had 5 homes sold in this group for an average of $169 per SqFt. & the average time on the market was 49 days. 5 Homes sold in March 2020 for an average of $150 per sqft. & the average time on the market was 47 days. March 2019 had 8 homes sell for an average of $128 per sqft. & the average time on the market was 46 days.

The volume of Post Falls home sales on 1-3 acres is up by 2 homes and the average sales price per sq.ft. is down 26% compared to March 2022.
3 Post Falls homes on 1 to 3 acres were sold in March 2023 for an average of $294 per square foot. The average time on the market was 70 days. The average lot size was 1 acre.
These homes sold for an average of 96% of the original listed price. The high seller of the group sold for an average of $316 per sq.ft. and was from the Greenacres subdivision. The low seller of the group sold for an average of $271 per sq.ft.
1 Home sold in March 2022 for an average of $400 per SqFt. The average time on the market was 55 days. The average size of the lot was 1.03 acres.
March 2021 had 2 homes sell for an average of $420 per SqFt. & the average time on the market was 60 days. 1 Home sold in March 2020 for an average of $188 per sqft. & the average time on the market was 49 days. March 2019 had one home sell for an average of $164 per sqft. & the average time on the market was 168 days. March 2018 had 1 home sell for an average of $91 per sqft & an average of 70 days on the market.

The volume of home sales on 4 to 6 acres is up by one home and the average sales price per square foot is up 37% compared to March 2022.
3 Homes on 4 to 6 acres were sold in Post Falls, Idaho in March 2023 for an average of $403 per sq.ft. The average time on the market was 78 days. The average lot size was 5 acres.
These homes sold for an average of 110% of the original listed price. The high seller of the group sold for an average of $592 per sq.ft. The low seller of the group sold for an average of $298 per sq.ft. and was from the Greenacres subdivision.
2 Homes sold in March 2022 for an average of $294 per SqFt. The average time on the market was 324 days. The average lot size was 4.75 acres.
March 2021 had 3 homes sell for an average of $345 per SqFt. & the average time on the market was 144 days. 2 Homes sold in March 2020 for an average of $266 per sqft. and the average time on the market was 90 days. No March 2019 sales. March 2018 had 2 homes sell for an average price per sqft of $142 and an average of 74 days on the market.

1 Post Falls home on an average of 10 acres was sold in March 2023 for an average of $461 per sq.ft. The average time on the market was 63 days. This home sold for an average of 93% of the original listed price.
No March 2022 home sales in this group.
March 2021 had 1 home sell for an average of $577 per SqFt. & the average time on the market was 2 days. 1 Home sold in the 6-10 acre category during March 2020 for an average of $220 per sqft. and the average time on the market was 95 days. No March 2019 home sales to compare to.
No Post Falls homes with over 10 acres were sold in March 2023.
No March 2022 home sales in this group.
No March 2021 home sales in this group. No March 2020 or 2019 home sales in this group.
1 Waterfront home sold in Post Falls, Idaho in March 2023 for an average of $742 per sq.ft. The average time on the market was 160 days. The average size of the lot was 0.9 acres. This home sold for an average of 74% of the original listed price and was from the Hardings subdivision.
No waterfront home sales in March 2022.
March 2021 had 1 waterfront home sell for an average of $511 per SqFt. with an average of 52 days on the market. 1 Waterfront condo sold for an average of $377 per SqFt. with an average of 10 days on the market. 2 Waterfront homes sold in March 2020 for an average of $136 per sqft. & the average time on the market was 229 days. March 2019 had 2 waterfront homes sell for an average of $300 per sqft. & the average time on the market was 118 days. March 2018 had 4 waterfront homes sell for an average price per sqft of $248.
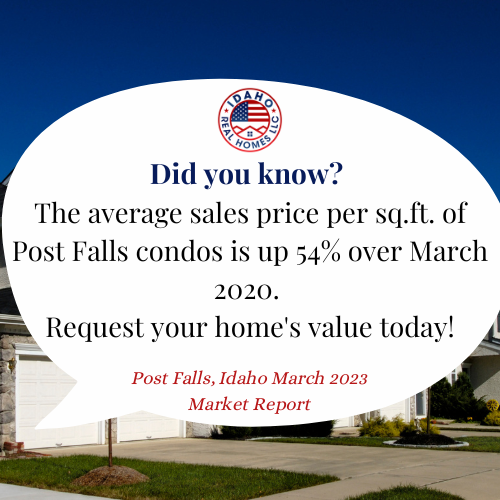
The volume of Post Falls condo sales is down by 3 homes and the average sales price per sq.ft. is down by 9% compared to March 2022.
3 Condos were sold in Post Falls, Idaho in March 2023 for an average of $264 per sq.ft. The average time on the market was 118 days. The average lot size was 0.07 acres.
These homes sold for an average of 94% of the original listed price. The high seller of the group sold for an average of $284 per sq.ft. and was from the Skywagon Condos. The low seller of the group sold for an average of $250 per sq.ft. and was from the Promenade subdivision.
6 Condos sold in March 2022 for an average of $291 per SqFt. The average time on the market was 38 days.
March 2021 had 3 condos sell for an average of $266 per SqFt. & the average time on the market was 32 days. 3 Condos sold in March 2020 for an average of $171 per sqft. and the average time on the market was 44 days. No March 2019 home sales. March 2018 had 2 condos sell for an average of $129 per sqft. with an average of 45 days on market.
No townhome sales in Post Falls, Idaho in the month of March 2023.
No March 2022 townhome sales in Post Falls.
No Townhome sales in March 2021, 2020, 2019, or 2018 in Post Falls, Idaho.
The volume of Post Falls mobile home sales on leased land is up by 5 homes and the average sales price per sq.ft. is down 21% compared to March 2022.
9 Manufactured homes on leased lots were sold in Post Falls, Idaho in March 2023 for an average of $101 per sq.ft. The average time on the market was 110 days.
These mobile homes sold for an average of 81% of the original listed price. The high seller of the group sold for an average of $130 per sq.ft. and was from the Camelot Estates. The low seller of the group sold for an average of $69 per sq.ft. and was from the Chateau park.
4 Manufactured homes on leased lots sold in March 2022 for an average of $129 per SqFt. The average time on the market was 27 days.
March 2021 had 3 manufactured homes sell for an average of $77 per SqFt. & the average time on the market was 31 days. 4 Manufactured homes on leased lots sold in March 2020 for an average of $69 per sqft. & the average time on the market was 46 days. 4 Manufactured homes on leased lots sold in March 2019 for an average price per sqft of $38 with an average of 50 days on the market.
