
350 E Kathleen Ave
ste, 400
Coeur d' Alene, Id
83815
1-208-719-9010
Call or text
Mon - Fri: 9:00 - 5pm
Weekends by appointment Book your apt Here

ste, 400
Coeur d' Alene, Id
83815
Call or text
Weekends by appointment Book your apt Here

ste, 400 Coeur d' Alene, Id 83815
Call or text
Weekends by appointment
Book your apt Here
Last updated on May 21st, 2023 at 12:34 pm
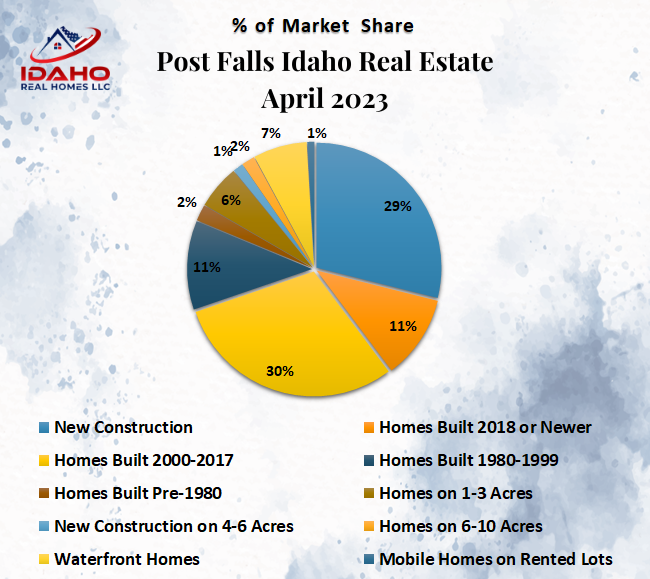
67 Homes were sold in Post Falls, Idaho in April 2023. Homes on less than an acre sold for an overall average of $282 per square foot, were on the market for an average of 93 days, and sold for an average of 97% of the original listed price. The average sales price per sq.ft. is down 9% over April 2022. Volume is down 30%.
96 Homes were sold in Post Falls in April 2022 for an overall average of $311 per sq.ft., they were on the market for an average of 56 days, and sold for an average of 103% of the original listed price.
April 2021 had 132 home sales, April 2020 had 84 home sales, April 2019 had 116 home sales, and April 2018 had 89 home sales.
Read more below for more information about the average sales price per square foot of new construction, homes on city lots, homes on land, waterfront, and more! For more information about Post Falls, visit our Post Falls, Idaho Real Estate page here!
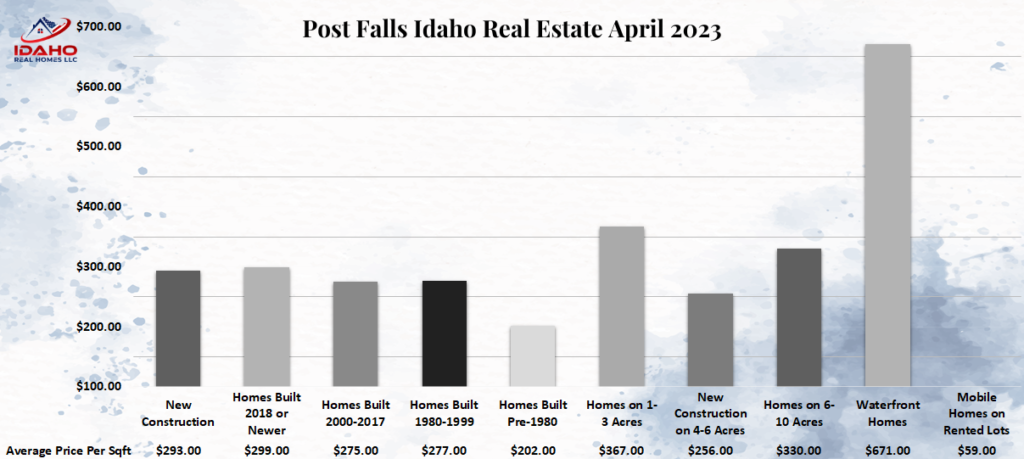
The volume of Post Falls new construction home sales is consistent with last year and the average sales price per sq.ft. is down 6% over April 2022.
19 New construction homes sold in Post Falls, Idaho in April 2023 for an average of $293 per sq.ft. The average lot size was 0.2 acres.
These homes sold for an average of 98% of the original listed price. The high seller of the group sold for an average of $400 per sq.ft. The low seller of the group sold for an average of $205 per sq.ft. and was from the Wrenley Estates.
Home sales in this group include homes from the Foxtail; Montrose; and North Place communities.
19 New construction homes sold in April 2022 for an average of $311 per SqFt.
25 New construction homes sold during April 2021 for an average of $226 per sqft. 18 New construction homes sold during April 2020 for an average of $197 per sqft. April 2019 had 36 new construction homes sell for an average of $149 per sqft. April 2018 had 25 new construction homes sell for an average price per sqft of $151.


The volume of Post Falls home sales in this age group is down 30% and the average sales price per square foot is down 2% compared to April 2022.
7 Homes that were built in 2018 or newer were sold in Post Falls, Idaho in April 2023 for an average of $299 per sq.ft. The average time on the market was 67 days. The average lot size was 0.17 acres.
These homes sold for an average of 98% of the original listed price. The high seller of the group sold for an average of $364 per sq.ft. and was from the Crown Pointe subdivision. The low seller of the group sold for an average of $222 per sq.ft. and was also from the Crown Pointe subdivision.
Home sales in this group also include homes from the Woodbridge community.
10 Homes, built 2018 or newer, sold in April 2022 for an average of $306 per sq.ft. & were on the market for an average of 37 days.
8 Homes sold in April 2021 for an average of $299 per sq.ft. and were on the market for an average of 36 days. April 2020 had 4 homes sell for an average of $184 per sq.ft. & were on the market for an average of 38 days.
The volume of Post Falls home sales in the 2000 to 2017 age group is down 16% and the average sales price per sq.ft. is down 14% over April 2022.
21 Homes that were built from 2000 to 2017 were sold in Post Falls, Idaho in April 2023 for an average of $275 per sq.ft. The average time on the market was 80 days. The average lot size was 0.2 acres.
These homes sold for an average of 98% of the original listed price. The high seller of the group sold for an average of $399 per sq.ft. and was from the Tullamore subdivision. The low seller of the group sold for an average of $180 per sq.ft. and was from the Montrose subdivision.
Home sales in this group include homes from the Crown Pointe; Fieldstone; Greenside Vista; and Woodbridge communities.
25 Homes, built 2000-2017, sold in April 2022 for an average of $320 per sq.ft. & were on the market for an average of 35 days.
41 Homes sold in April 2021 for an avergae of $263 per sq.ft. & were on the market for an average of 36 days. 32 Homes sold in April 2020 for an average of $187 per sq.ft. & were on the market for an average of 49 days. April 2019 had 35 homes sell for an average of $153 per sqft. and the average time on the market was 61 days. April 2018 had 20 homes sell for an average price per sqft of $150 with an average of 39 days on the market.


The volume of home sales in the 1980 to 1999 age group in Post Falls is down 42% and the average sales price per sq.ft. is down 18% compared to April 2022.
8 Homes that were built from 1980-1999 were sold in Post Falls in April 2023 for an average of $277 per sq.ft. The average time on the market was 70 days. The average lot size was 0.2 acres.
These homes sold for an average of 99% of the original listed price. The high seller of the group sold for an average of $385 per sq.ft. and was from the Caseys Place subdivision. The low seller of the group sold for an average of $197 per sq.ft. and was from the Highland Park subdivision.
Home sales in this group include homes from the Pioneer Ridge and Prairie Falls communities.
14 Homes built from 1980 to 1999 sold in April 2022 for an average of $339 per SqFt. The average time on the market was 32 days.
22 Homes sold in April 2021 for an average of $267 per sqft. The average time on the market was 51 days. 18 Homes sold in April 2020 for an average of $193 per sqft. The average time on the market was 45 days. April 2019 had 20 homes sell for an average of $156 per sqft. and the average time on the market was 57 days. April 2018 had 26 homes sell for an average of $132 per sqft and the average time on the market was 54 days.
The volume of home sales in the pre-1980 age group is down 50% and the average sales price per square foot is up 9% over April 2022.
2 Homes that were built before 1980 were sold in Post Falls in April 2023 for an average of $202 per sq.ft. The average time on the market was 100 days. The average lot size was 0.25 acres.
These homes sold for an average of 81% of the original listed price. The high seller of the group sold for an average of $243 per sq.ft. The low seller of the group sold for an average of $161 per sq.ft.
4 Homes built before 1980 sold in April 2022 for an average of $185 per SqFt. The average time on the market was 66 days.
8 Homes that were built pre-1980 sold during April 2021 for an average of $224 per sqft. The average time on the market was 36 days. 7 Homes that were built prior to 1980 sold in April 2020 for an average of $152 per sqft. The average time on the market was 44 days. April 2019 had 9 homes sell for an average of $139 per sqft. and the average time on the market was 67 days.

Here are all of the Post Falls homes on land for sale here and all of the vacant lots for sale in Post Falls. Contact us today for a showing or more information!

The volume of home sales on 1 to 3 acres is up by one home and the average sales price per square foot is down 10% compared to April 2022.
3 Homes on 1-3 acres were sold in Post Falls in April 2023 for an average of $367 per sq.ft. The average time on the market was 71 days. The average lot size was 2.5 acres.
These homes sold for an average of 89% of the original listed price. The high seller of the group sold for an average of $398 per sq.ft. and was from the East Greenacres subdivision. The low seller of the group sold for an average of $334 per sq.ft. and was from the Hilltop subdivision.
2 Homes sold in the 1-3 acre group in April 2022 for an average of $411 per SqFt. The average time on the market was 36 days.
7 Homes sold in April 2021 for an average of $297 per sqft. The average time on the market was 64 days. 2 Homes sold in April 2020 for an average of $227 per sqft. The average time on the market was 129 days. April 2019 had one home sale in this group that sold for an average of $162 per sqft. & the average time on the market was 57 days. April 2018 had 3 homes sell for an average price per sqft of $134 with average days on the market of 110 days.
The volume of home sales on 4 to 6 acres is consistent with last year and the average sales price per square foot is up 2% over April 2022.
1 New construction home sold in 4-6 acre group in Post Falls, Idaho in April 2023 for an average of $256 per sq.ft. The average time on the market was 87 days. The average lot size was 4.8 acres. This home sold for an average of 94% of the original listed price and was from the Garnet Ranch subdivision.
1 New construction home sold in the 4-6 acre group in April 2022 for an average of $250 per SqFt.
3 Homes sold in the 4-6 acre group during April 2021 for an average of $329 per sqft. The average time on the market was 47 days. 2 Homes sold in the 4-6 acre group during April 2020 for an average of $227 per sqft. The average time on the market was 87 days. April 2019 had 4 homes sell for an average of $172 per sqft. and the average time on the market was 92 days. April 2018 had 3 homes sell for an average price per sqft of $151 with an average of 121 days on market.
The volume of home sales on 6 to 10 acres is down one home and the average sales price per sq.ft. is down 15% compared to April 2022.
1 Home on 6-10 acres sold in Post Falls in April 2023 for an average of $330 per sq.ft. The average time on the market was 58 days. The average size of the lot was 10 acres. This home sold for an average of 99% of the original listed price.
2 Homes sold in April 2022 for an average of $390 per SqFt. The average time on the market was 98 days.
No April 2021 home sales in this group. 2 Homes sold in the 6-10 acre group during April 2020 for an average of $190 per sqft. The average time on the market was 78 days. No 2019 or 2018 home sales to compare to.

No Post Falls homes with over 10 acres were sold in April 2023.
No April 2022 home sales in this group.
No April 2021 home sales in this group. No April 2020 home sales in this group. No 2019 or 2018 home sales to compare to.
Volume is down by one home and the average sales price per sq.ft. for waterfront homes is up 54% over April 2022.
2 Waterfront homes were sold in Post Falls, Idaho in April 2023 for an average of $671 per sq.ft. The average time on the market was 84 days. The average lot size was 1.04 acres.
These homes sold for an average of 83% of the original listed price. The high seller of the group sold for an average of $955 per sq.ft. The low seller of the group sold for an average of $388 per sq.ft.
3 Waterfront homes sold in April 2022 for an average of $435 per SqFt. The average time on the market was 67 days. 1 Waterfront condo sold in April 2022 for an average of $579 per SqFt. and the average time on the market was 22 days.
No waterfront home sales in April 2021. 3 Waterfront homes sold in April 2020 for an average of $186 per sqft. The average time on the market was 42 days. No April 2019, or 2018 home sales in this group.
No Post Falls condo sales in April 2023.
2 Condos sold in April 2022 for an average of $271 per SqFt. The average time on the market was 59 days.
1 Condo sold in April 2021 for an average of $234 per sqft. The average time on the market was 37 days. 2 Condos sold during April 2020 for an average of $208 per sqft. The average time on the market was 44 days. 4 Condos sold in April 2019 for an average of $155 per sqft. & the average time on the market was 35 days. April 2018 had 4 condos sell for an average of $145 per sqft. & the average time on the market was 48 days.
The volume of mobile home sales is down 40% and the average sales price per sq.ft. is down 44% over April 2022.
3 Manufactured homes on leased lots were sold in Post Falls, Idaho in April 2023 for an average of $59 per sq.ft. The average time on the market was 36 days.
These homes sold for an average of 70% of the original listed price. The high seller of the group sold for an average of $119 per sq.ft and was from the River City Park. The low seller of the group sold for an average of $21 per sq.ft.
5 Manufactured homes on leased lots sold in April 2022 for an average of $106 per SqFt. The average time on the market was 42 days.
5 Manufactured homes sold in April 2021 for an average of $87 per sqft. The average time on the market was 41 days. 1 Manufactured home sold in April 2020 for an average of $56 per sqft. The average time on the market was 30 days. 6 Manufactured homes sold in April 2019 for an average of $55 per sqft. & the average time on the market was 84 days. April 2018 had 2 manufactured homes sell for an average price per sqft of $36 with an average of 105 days on the market.